Create Account
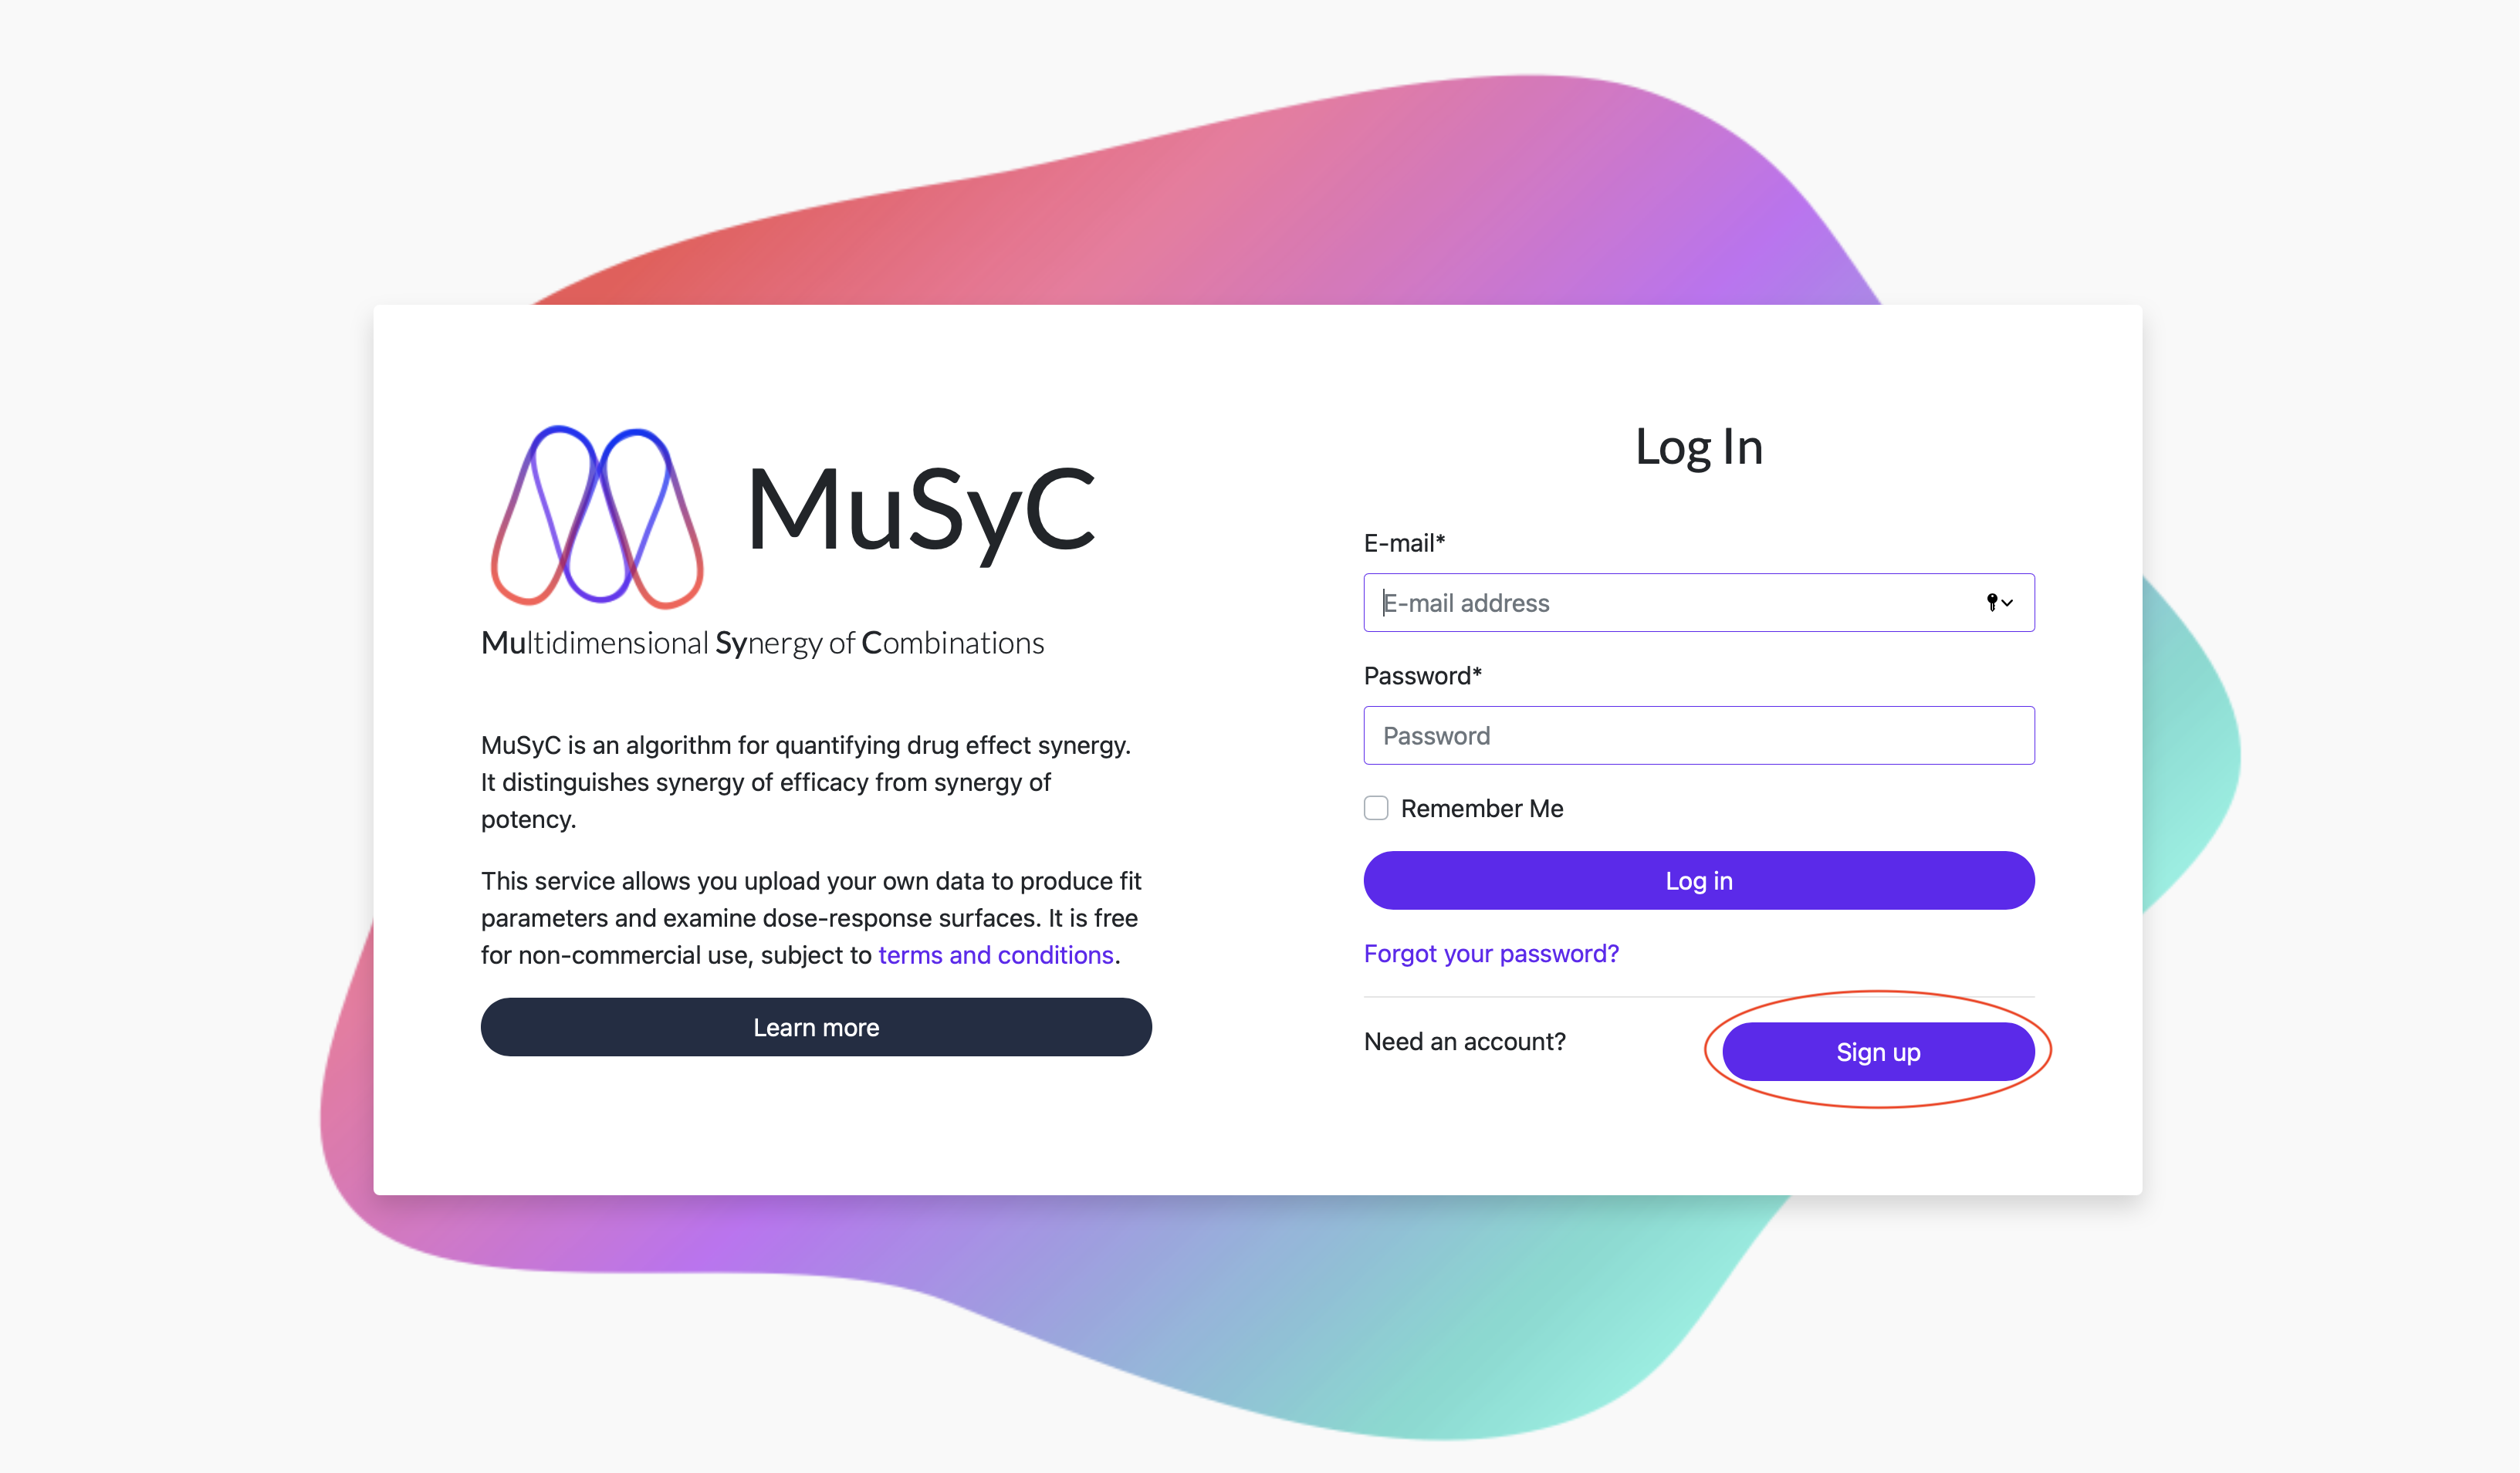
- 1
- Go to Create an account or click Sign Up on the login page.
- 2
- Enter your email address, first and last name, orginization, and create a password. Don't forget to review
the terms and conditions before you create your account. A verification email will be sent to the email you entered.
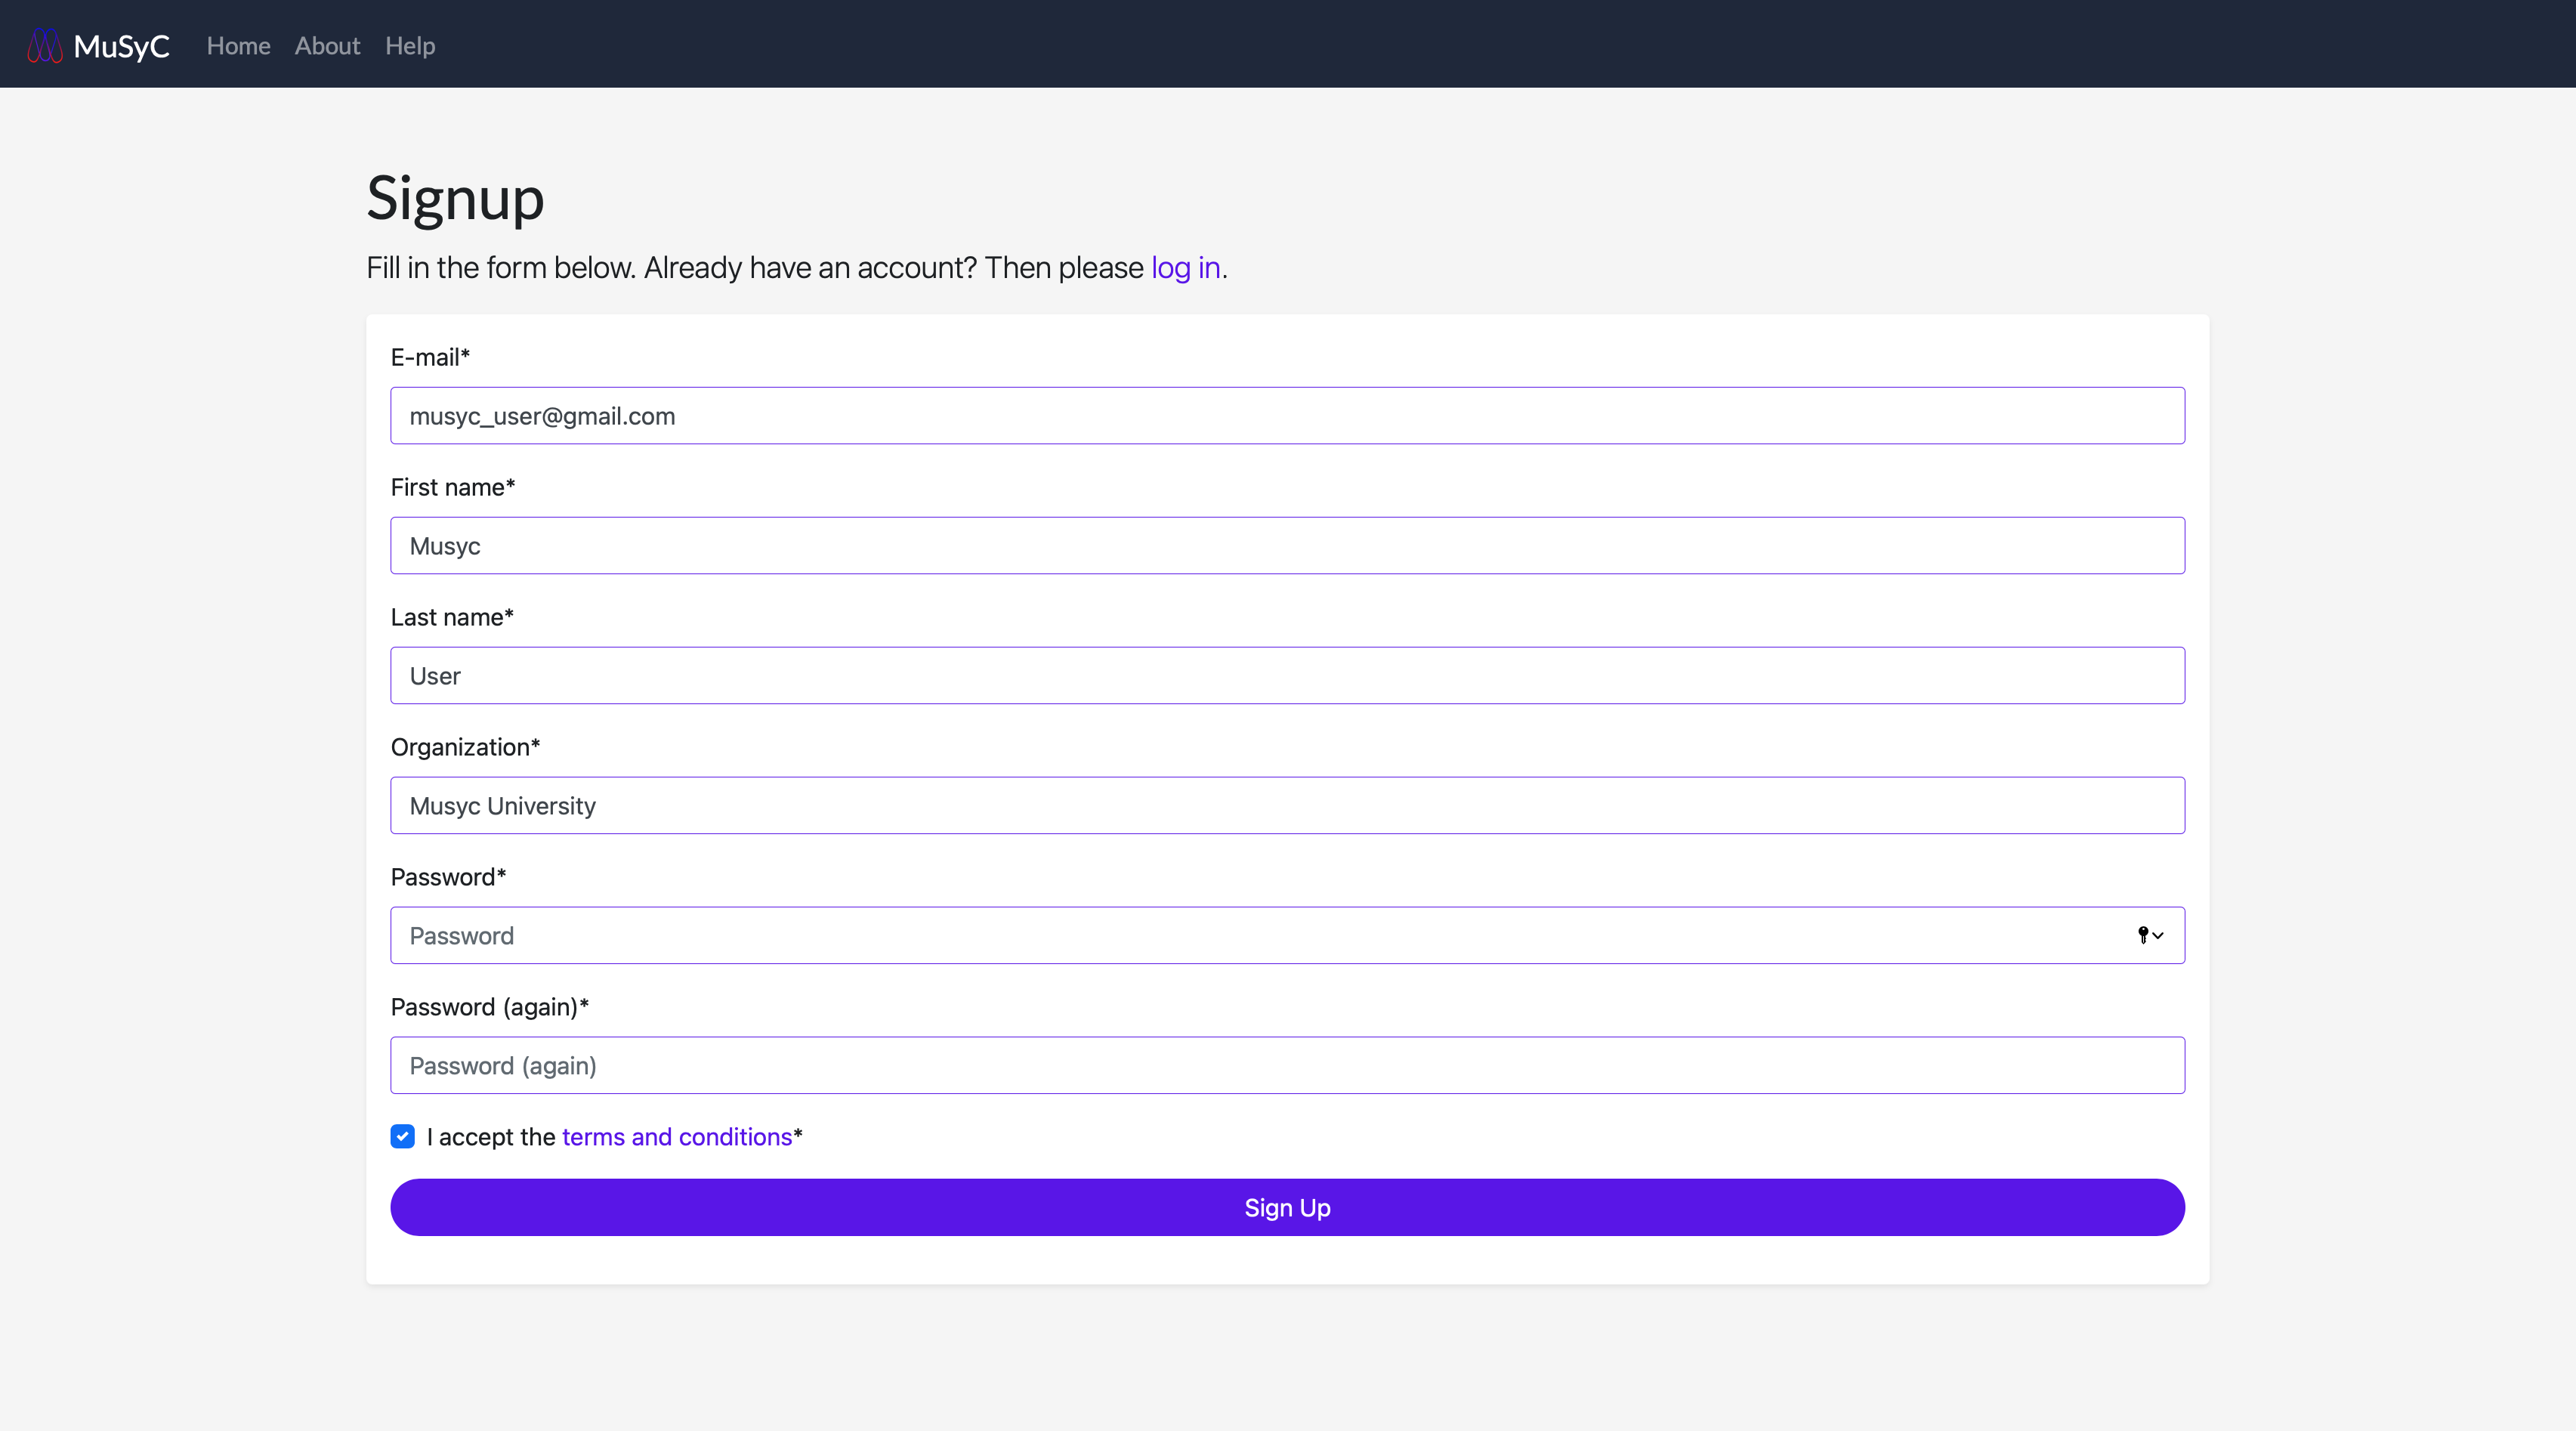
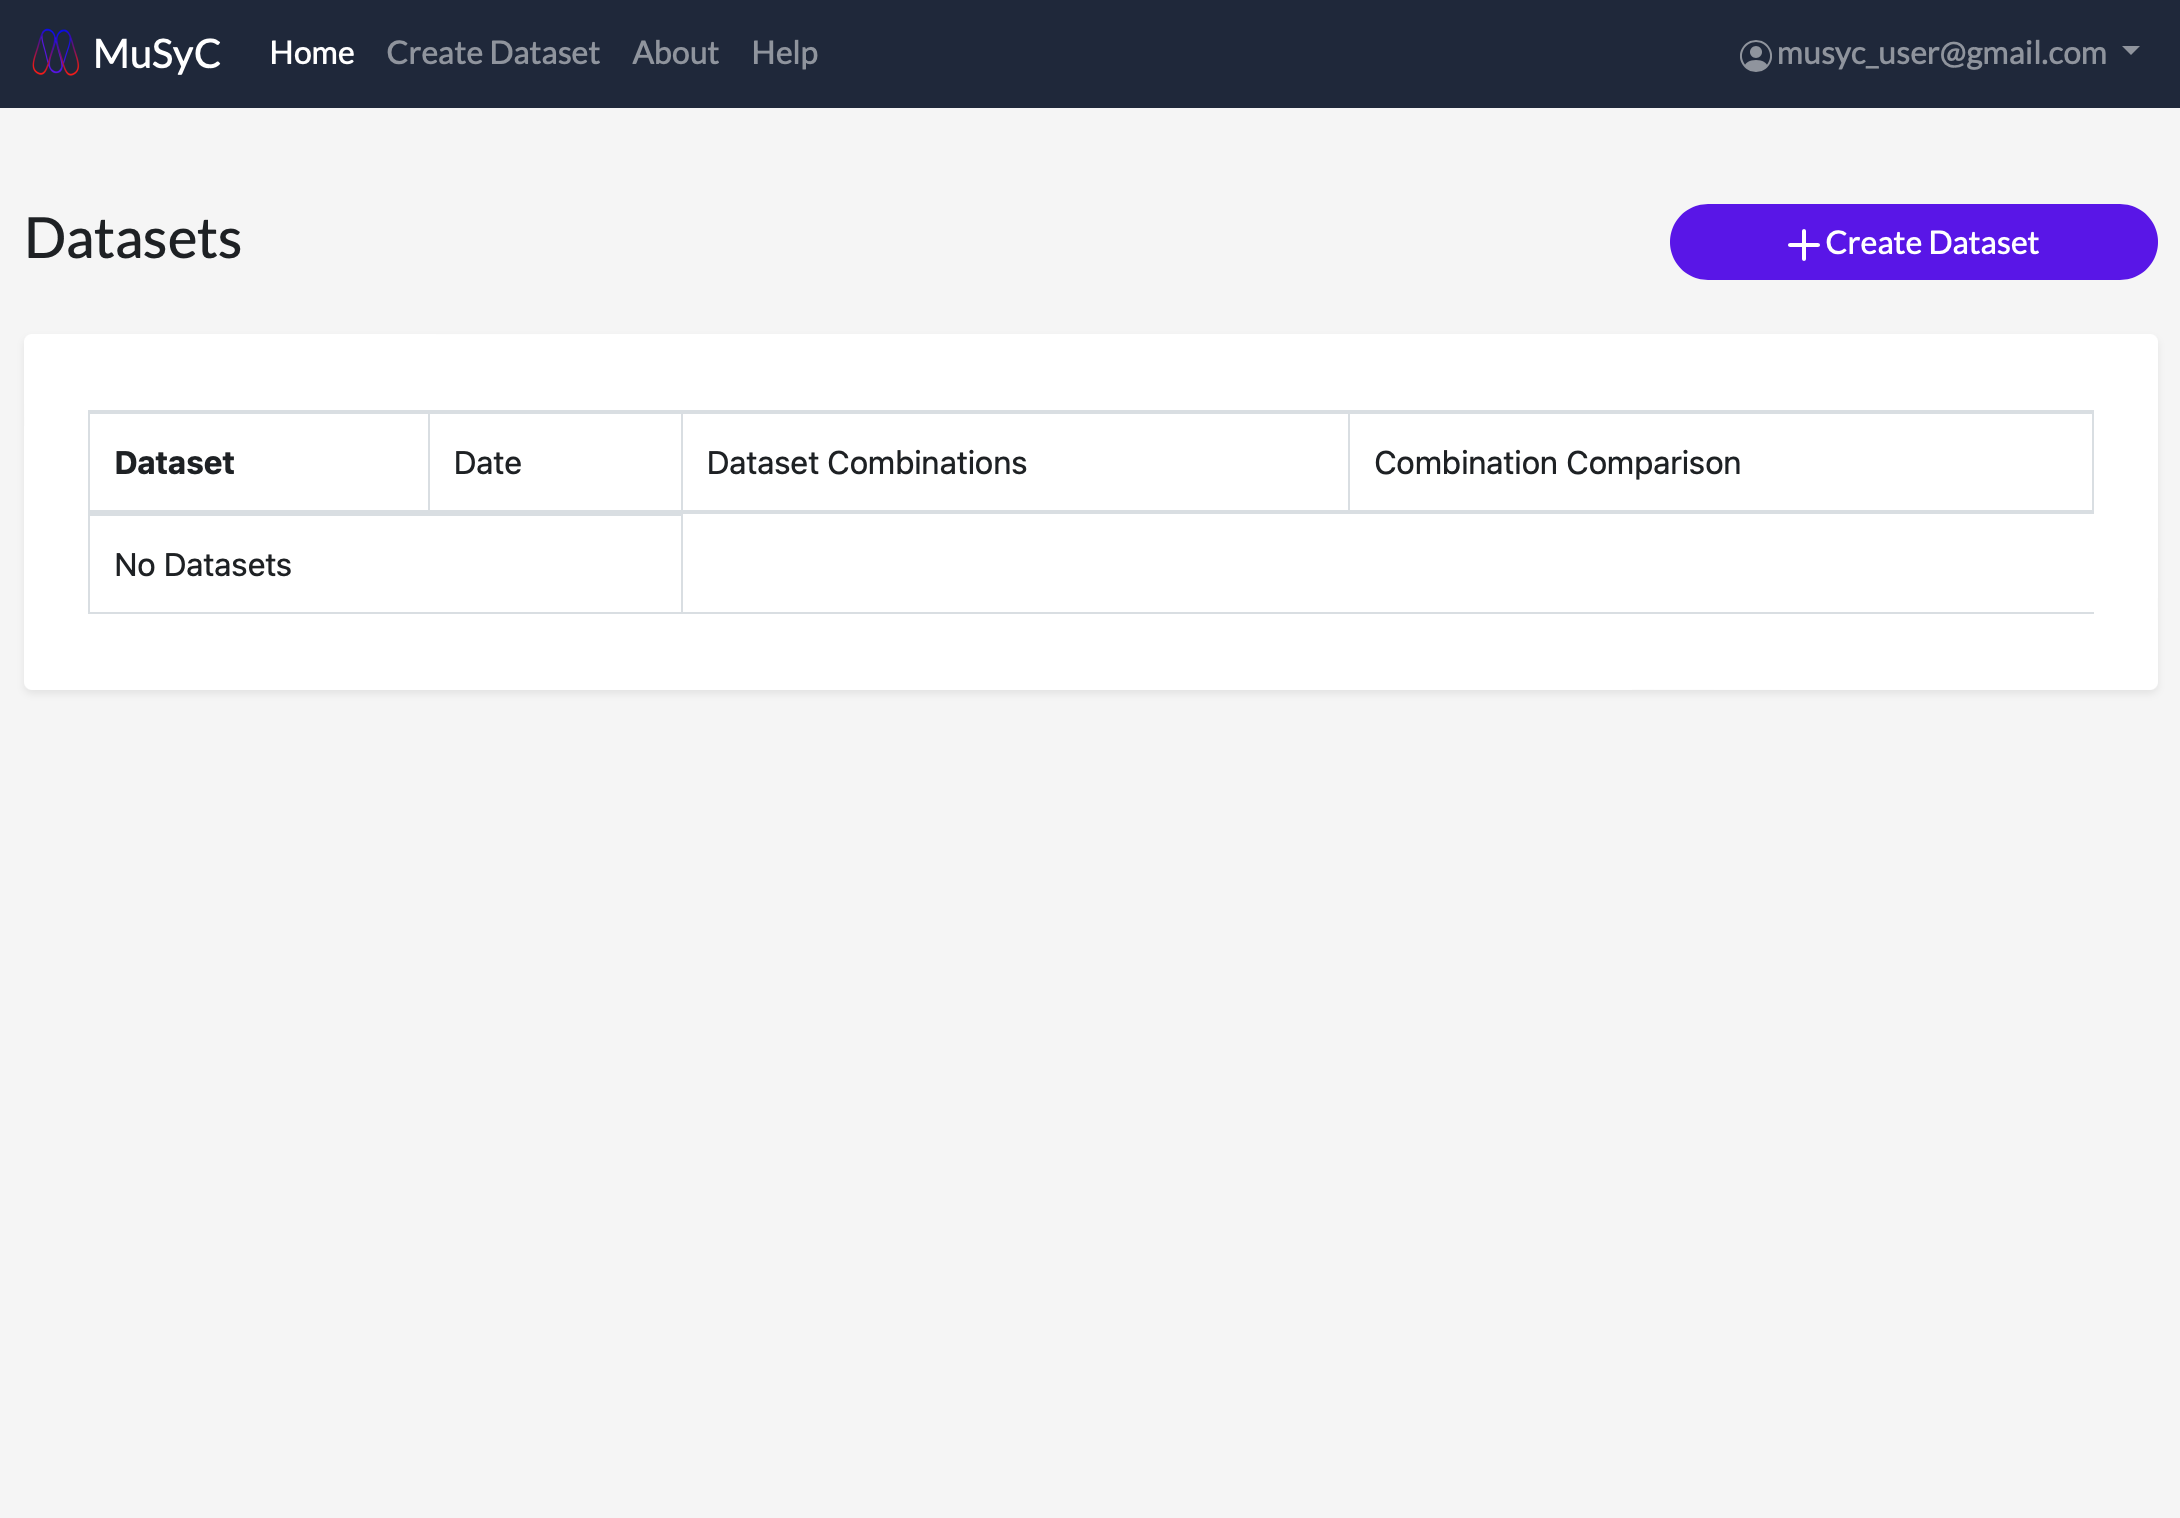
- 3
- You will be redirected to the home page upon successful account creation.
Manage Account
View and manage your account email address and password by clicking the username in the navigation bar. This will open a dropdown menu. Click Account to view the account menu.
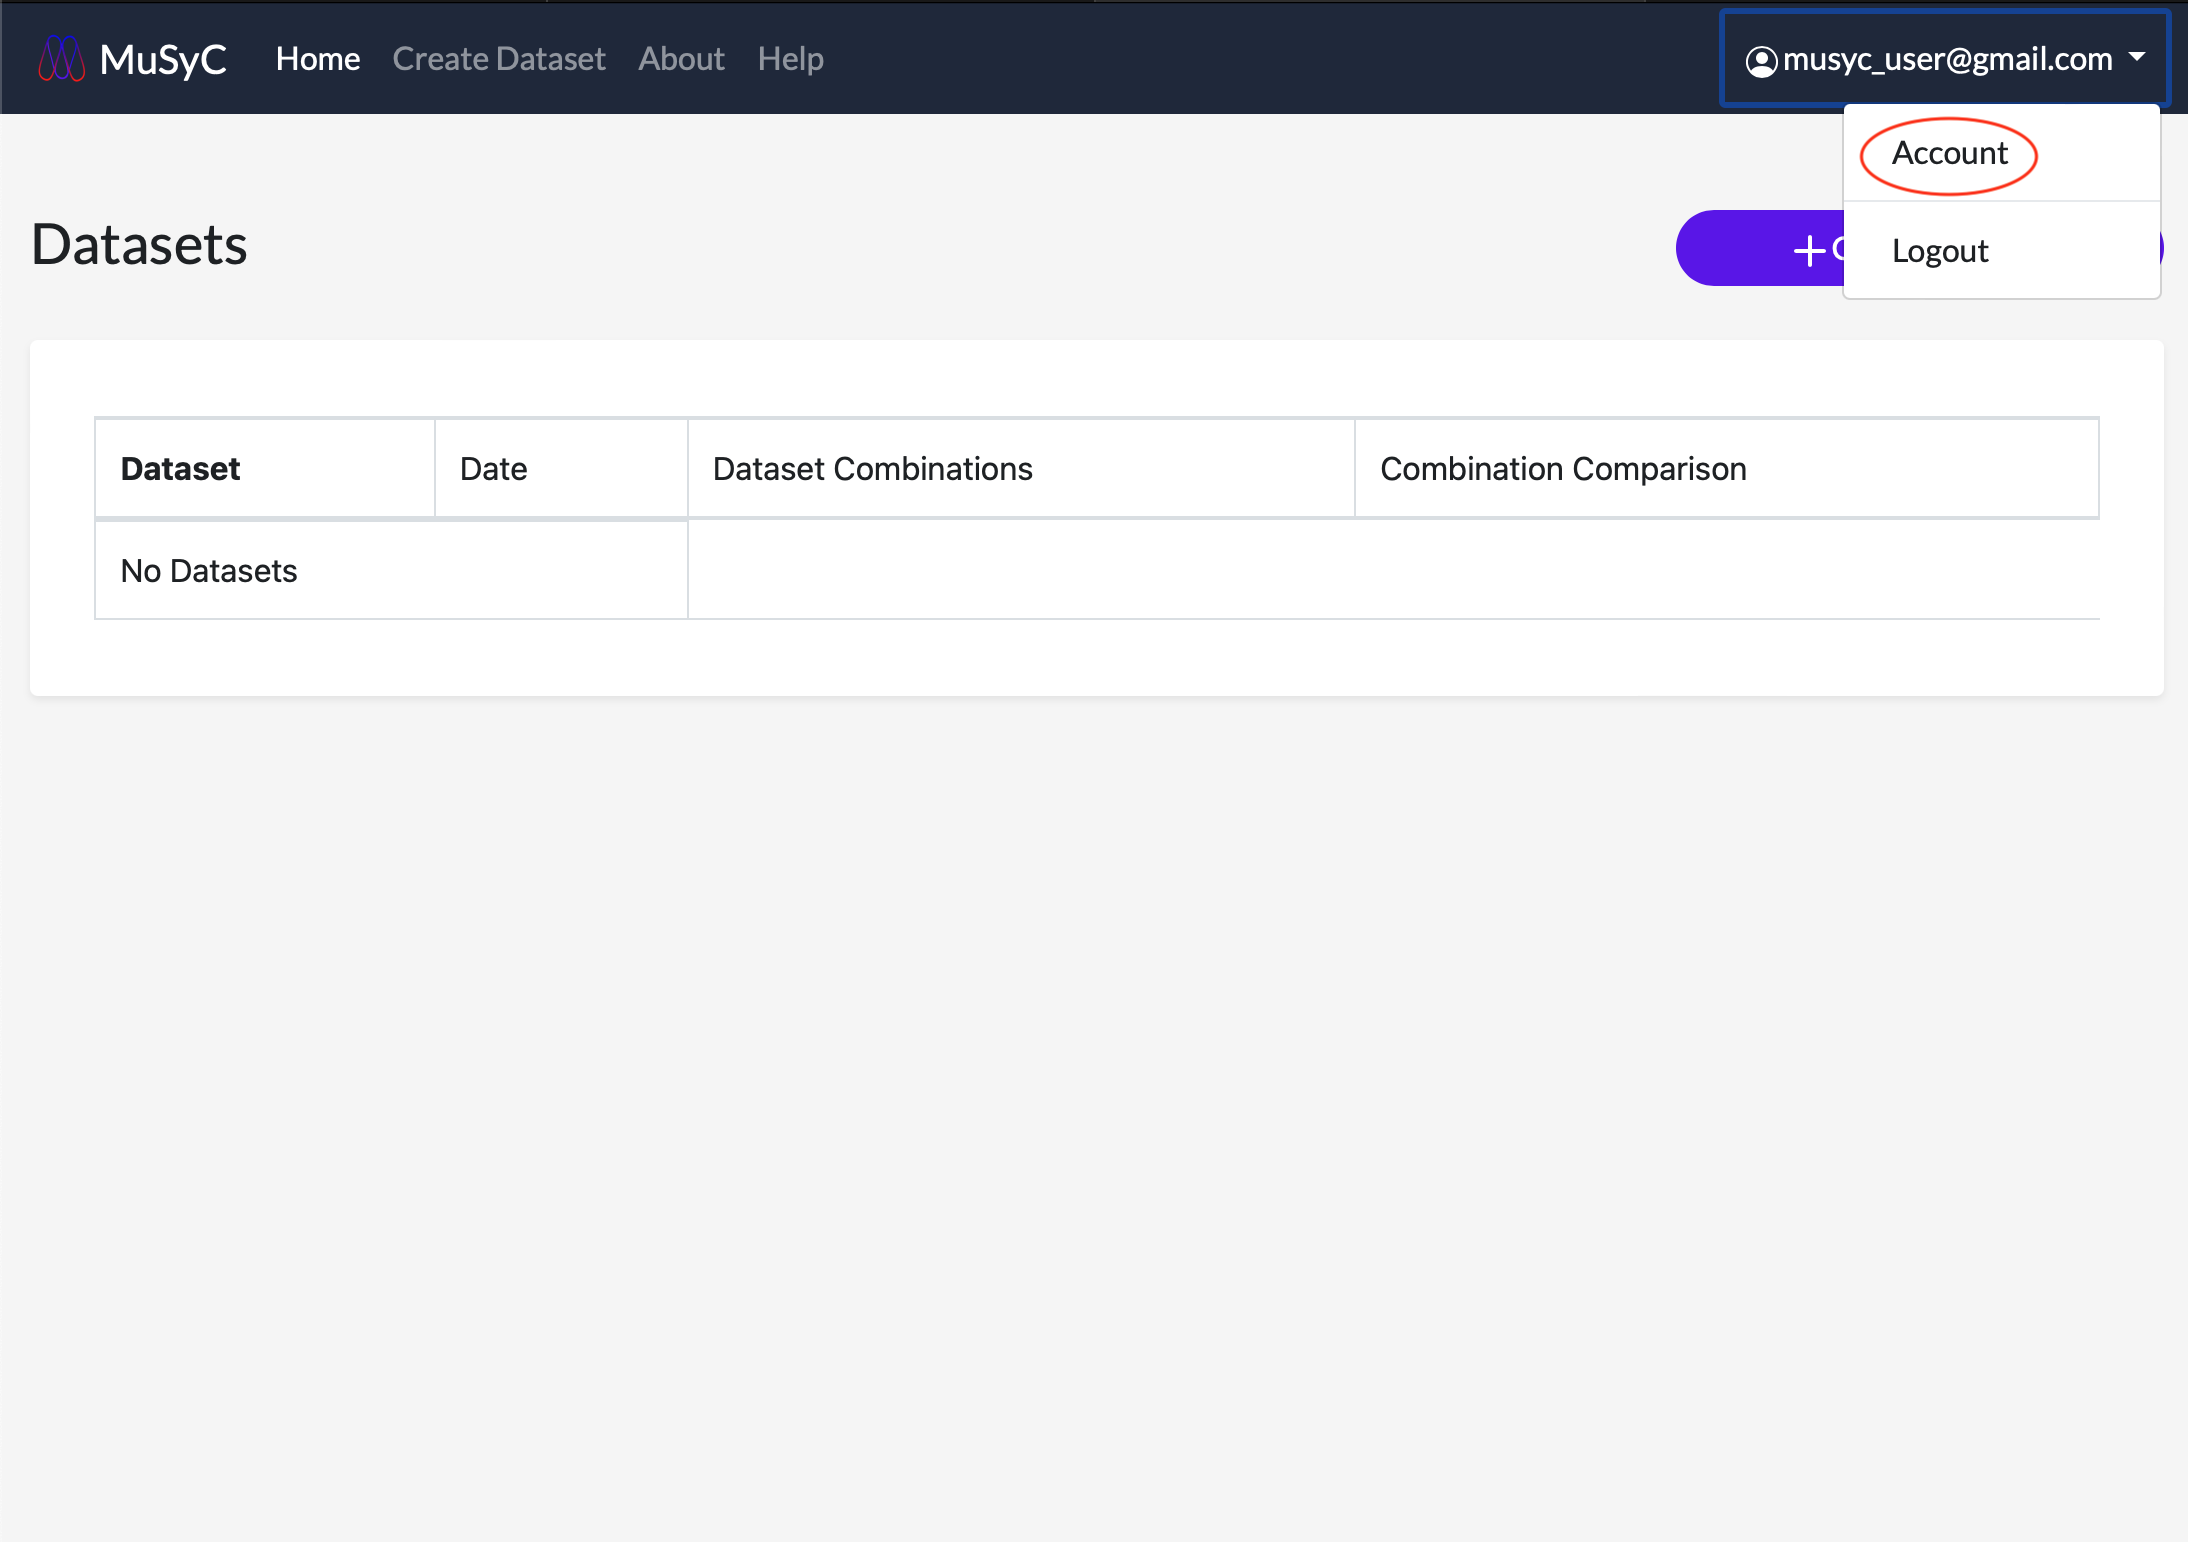
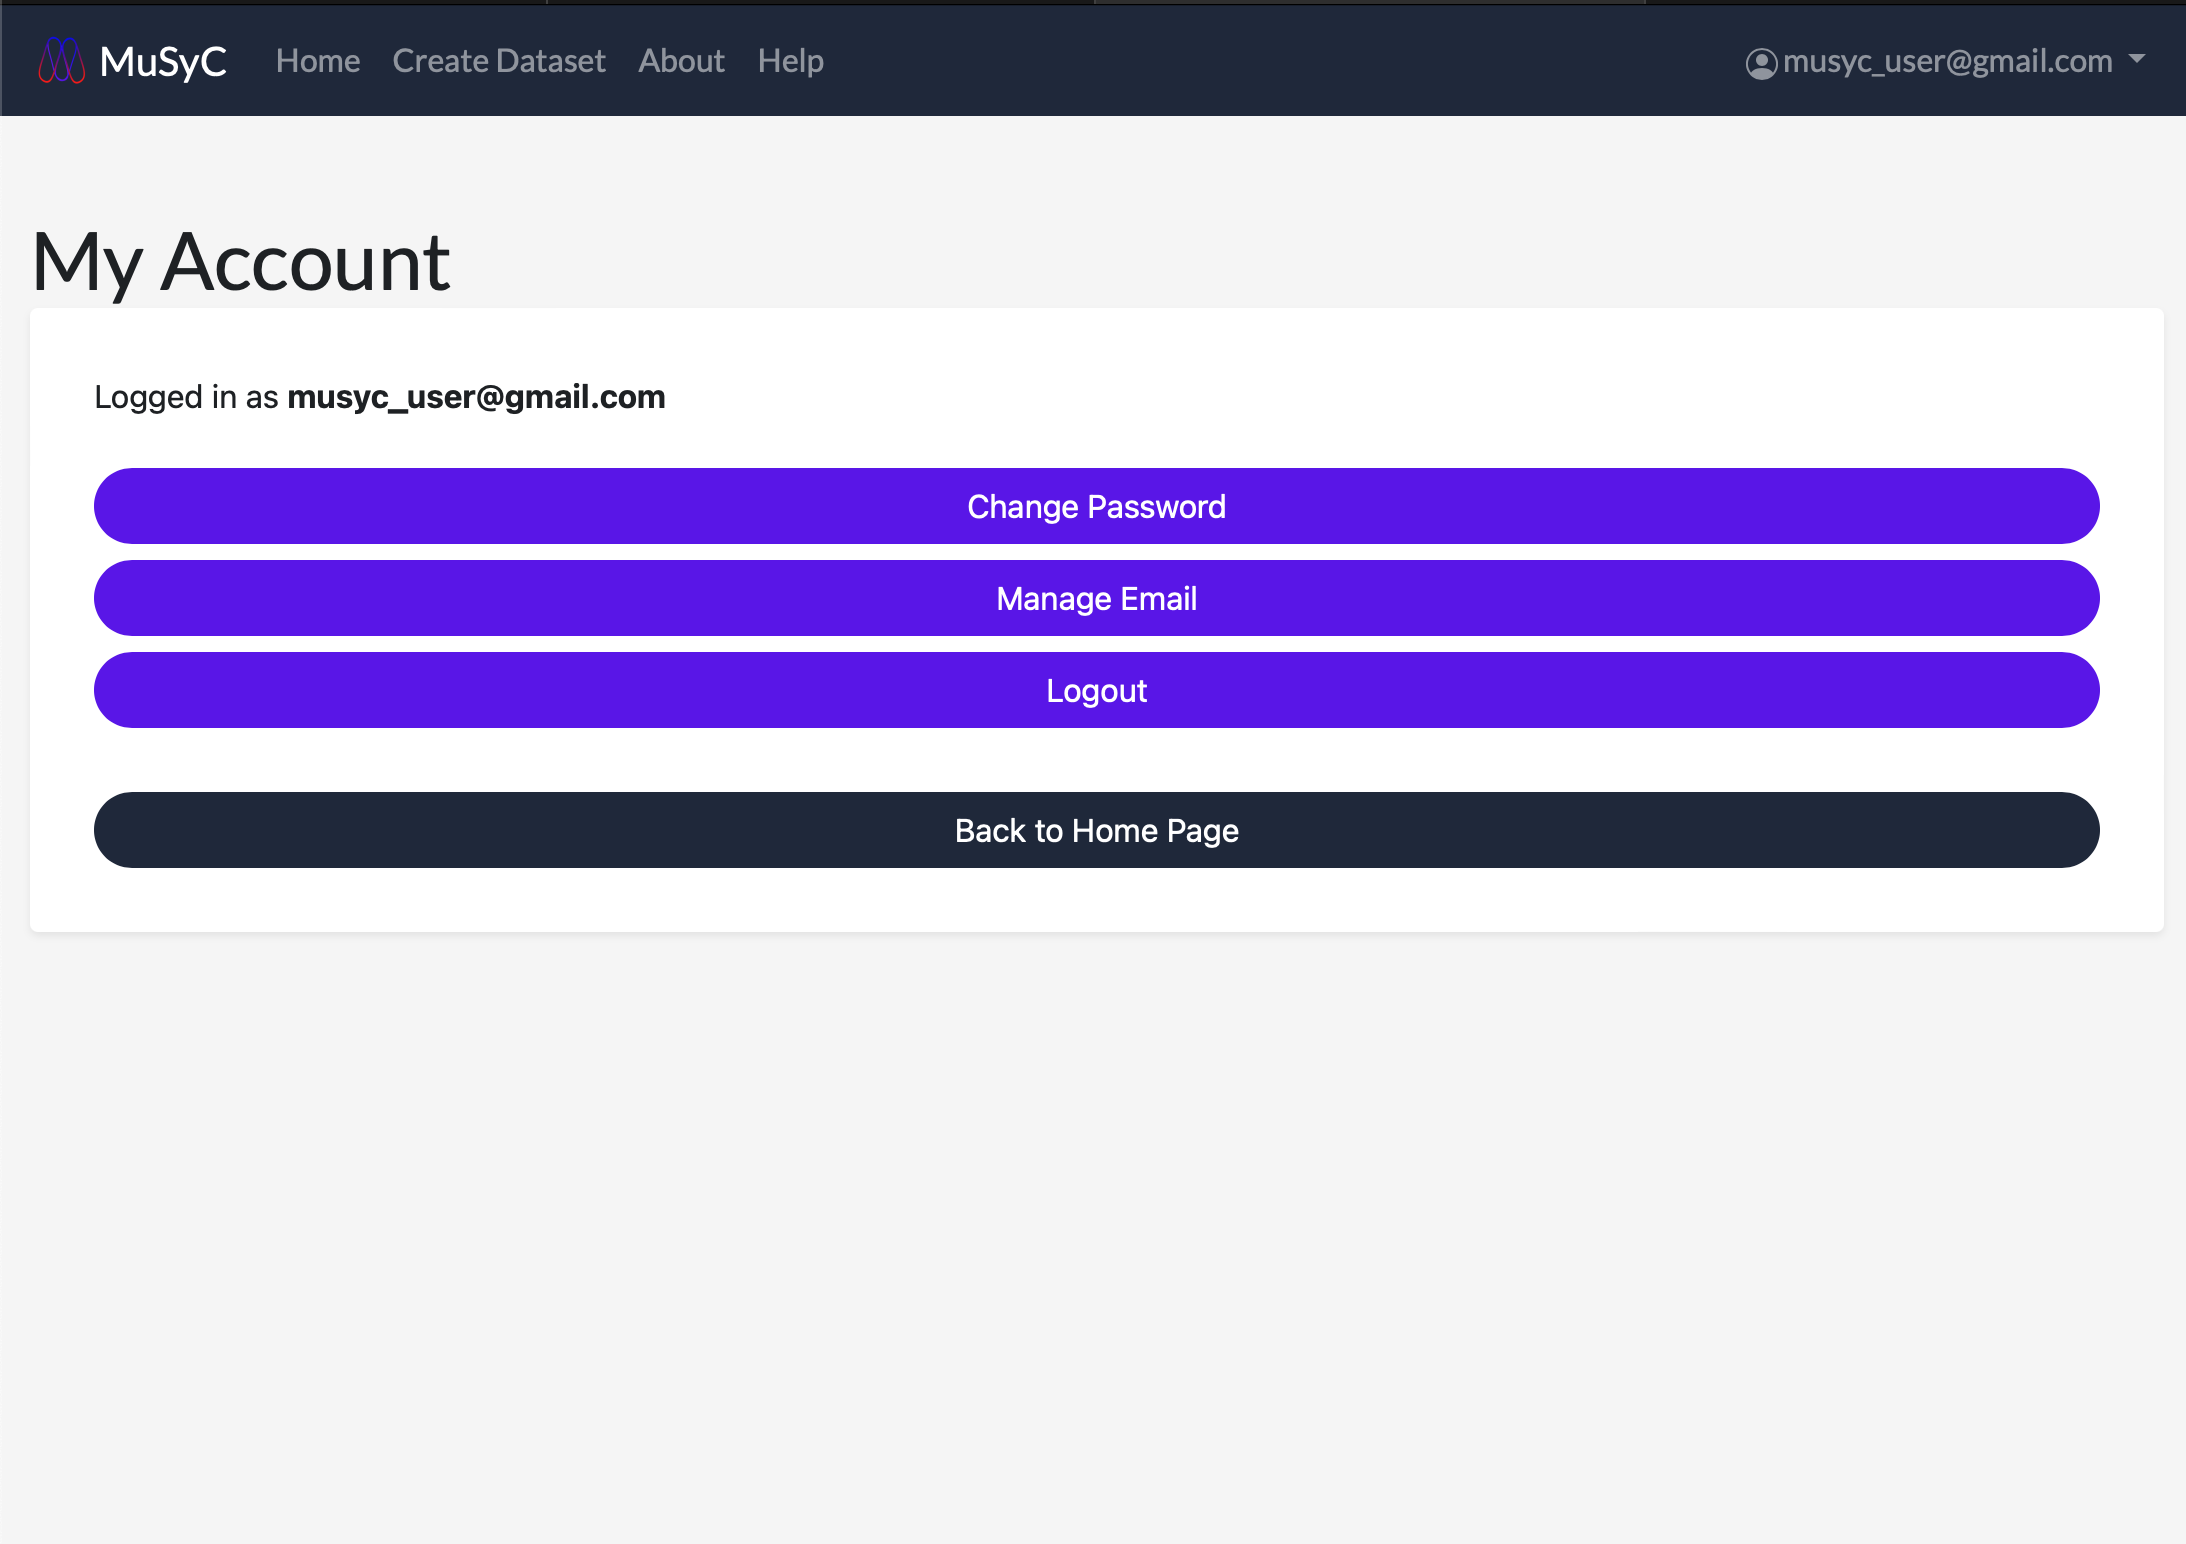
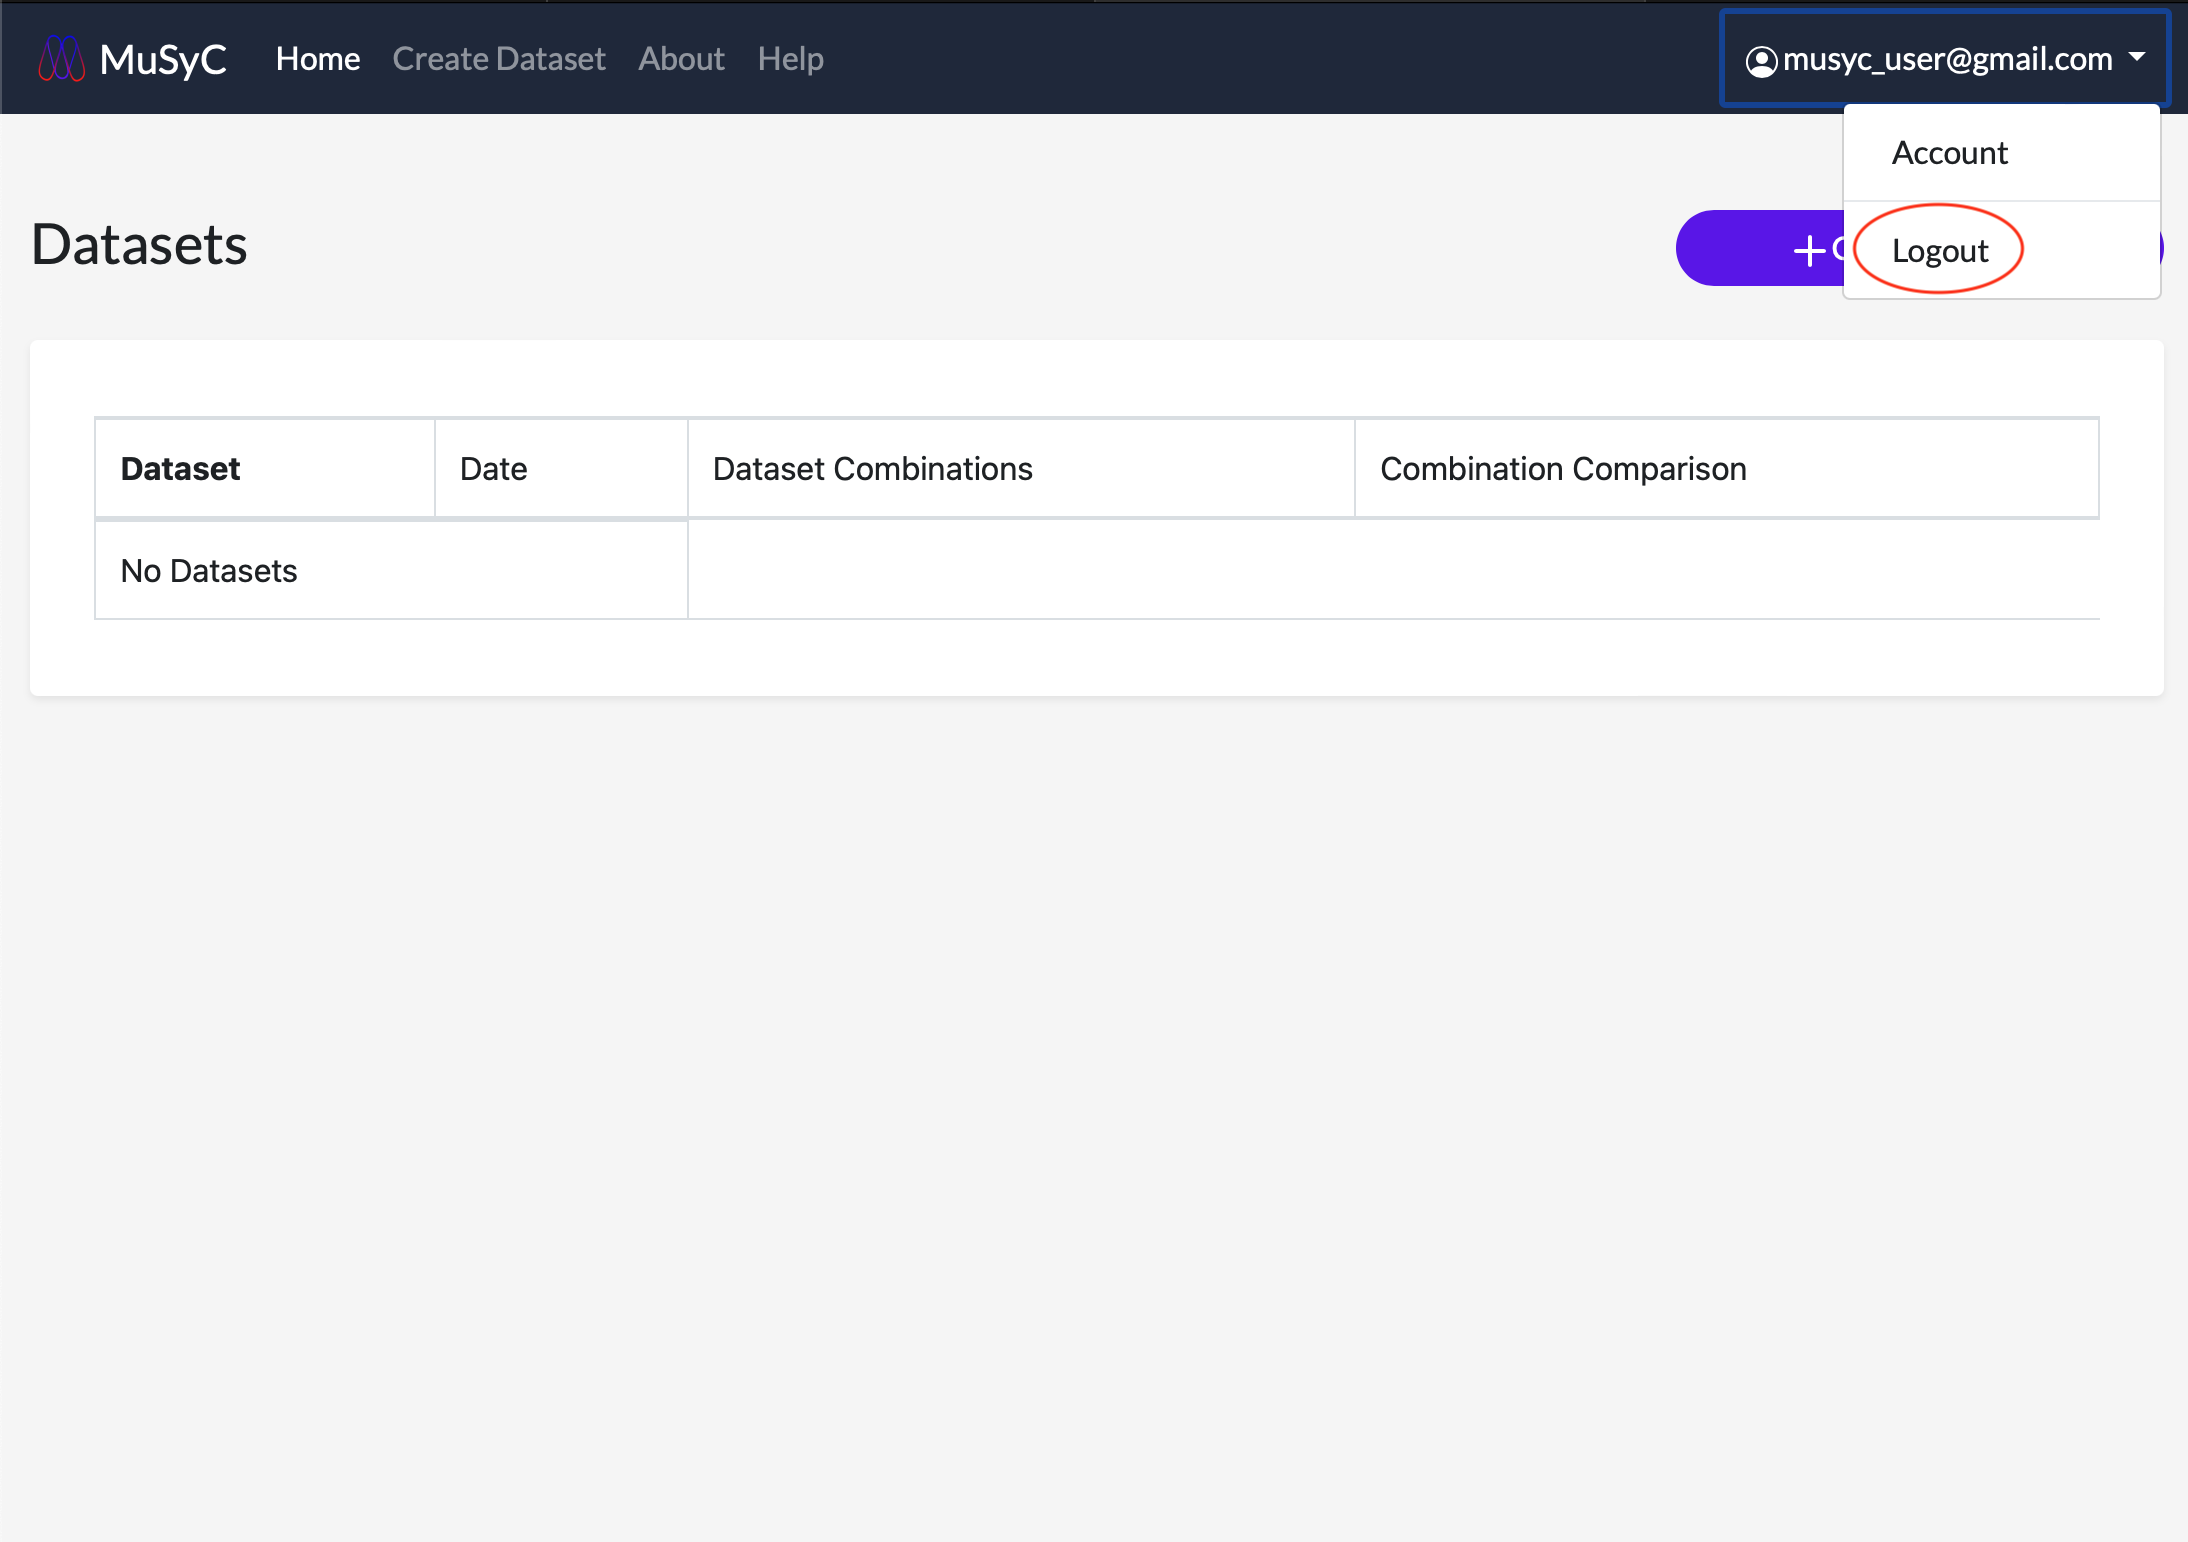
Logging Out
Click the username in the navigation bar. This will open a dropdown menu. Click Logout. You should see a messeage confirming you have logged out successfully.
Datasets
Create a Dataset
Data is uploaded in comma-separated value (CSV) format using the Unicode UTF-8 encoding (the default across most software). The required columns and their contents are shown in the table below. Combinations are grouped based on the sample, drug1, and drug2 columns, meaning multiple combinations can be uploaded in the same file and will be processed separately. The drug1.units and drug2.units are arbitrary but must be consistent within each combination.
Download the following demo dataset to view the data format and to test MuSyC functionality.
Input Data Format
| Column Name | Data Type | Description |
|---|---|---|
| expt.date | yyyy-mm-dd | Experiment date |
| drug1.conc | Float | Drug 1 concentration |
| drug2.conc | Float | Drug 2 concentration |
| effect | Float | Effect value (e.g., % viability, DIP rate) |
| sample | String | Sample name (e.g., name of cell line) |
| drug1 | String | Drug 1 name |
| drug2 | String | Drug 2 name |
| drug1.units | String | Drug 1 units (e.g., nM) |
| drug2.units | String | Drug 2 units (e.g., nM) |
| effect.95ci | Float (optional) | 95% confidence interval for effect value |
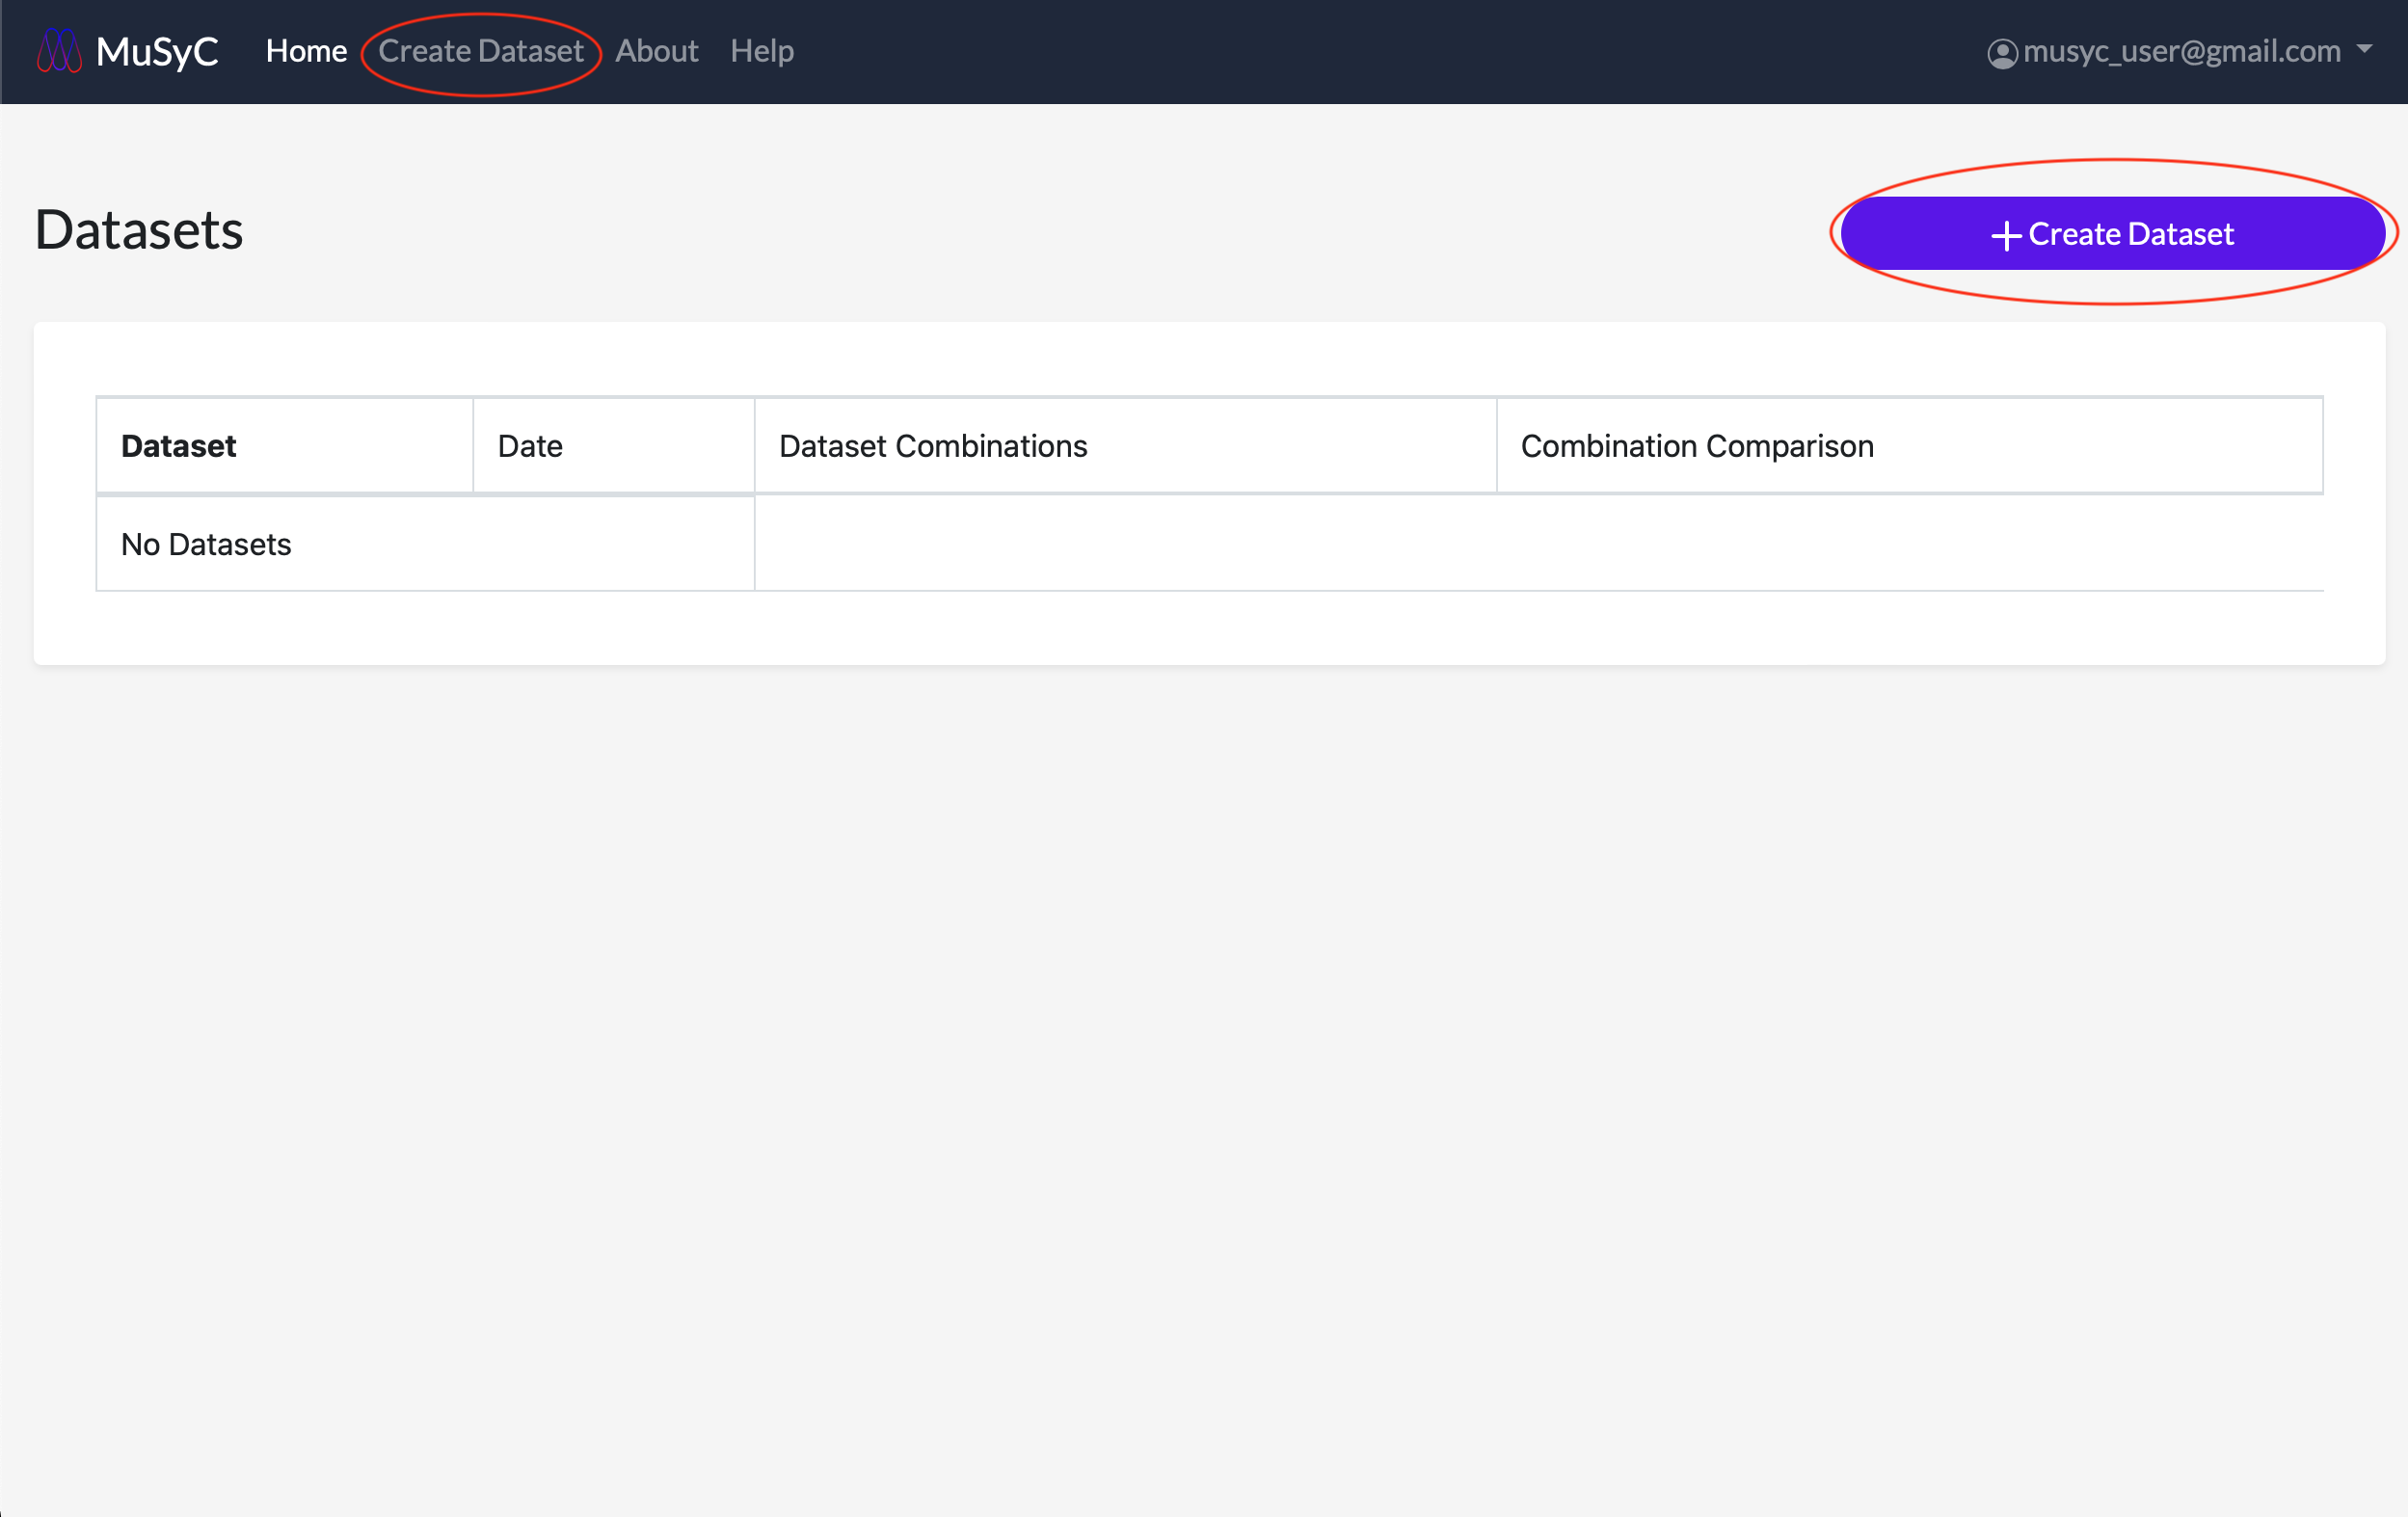
Upload Data
- 1
- On the home page click the Create Dataset button to open the new dataset form, or click the Create Dataset tab in the navigation bar.
- 2
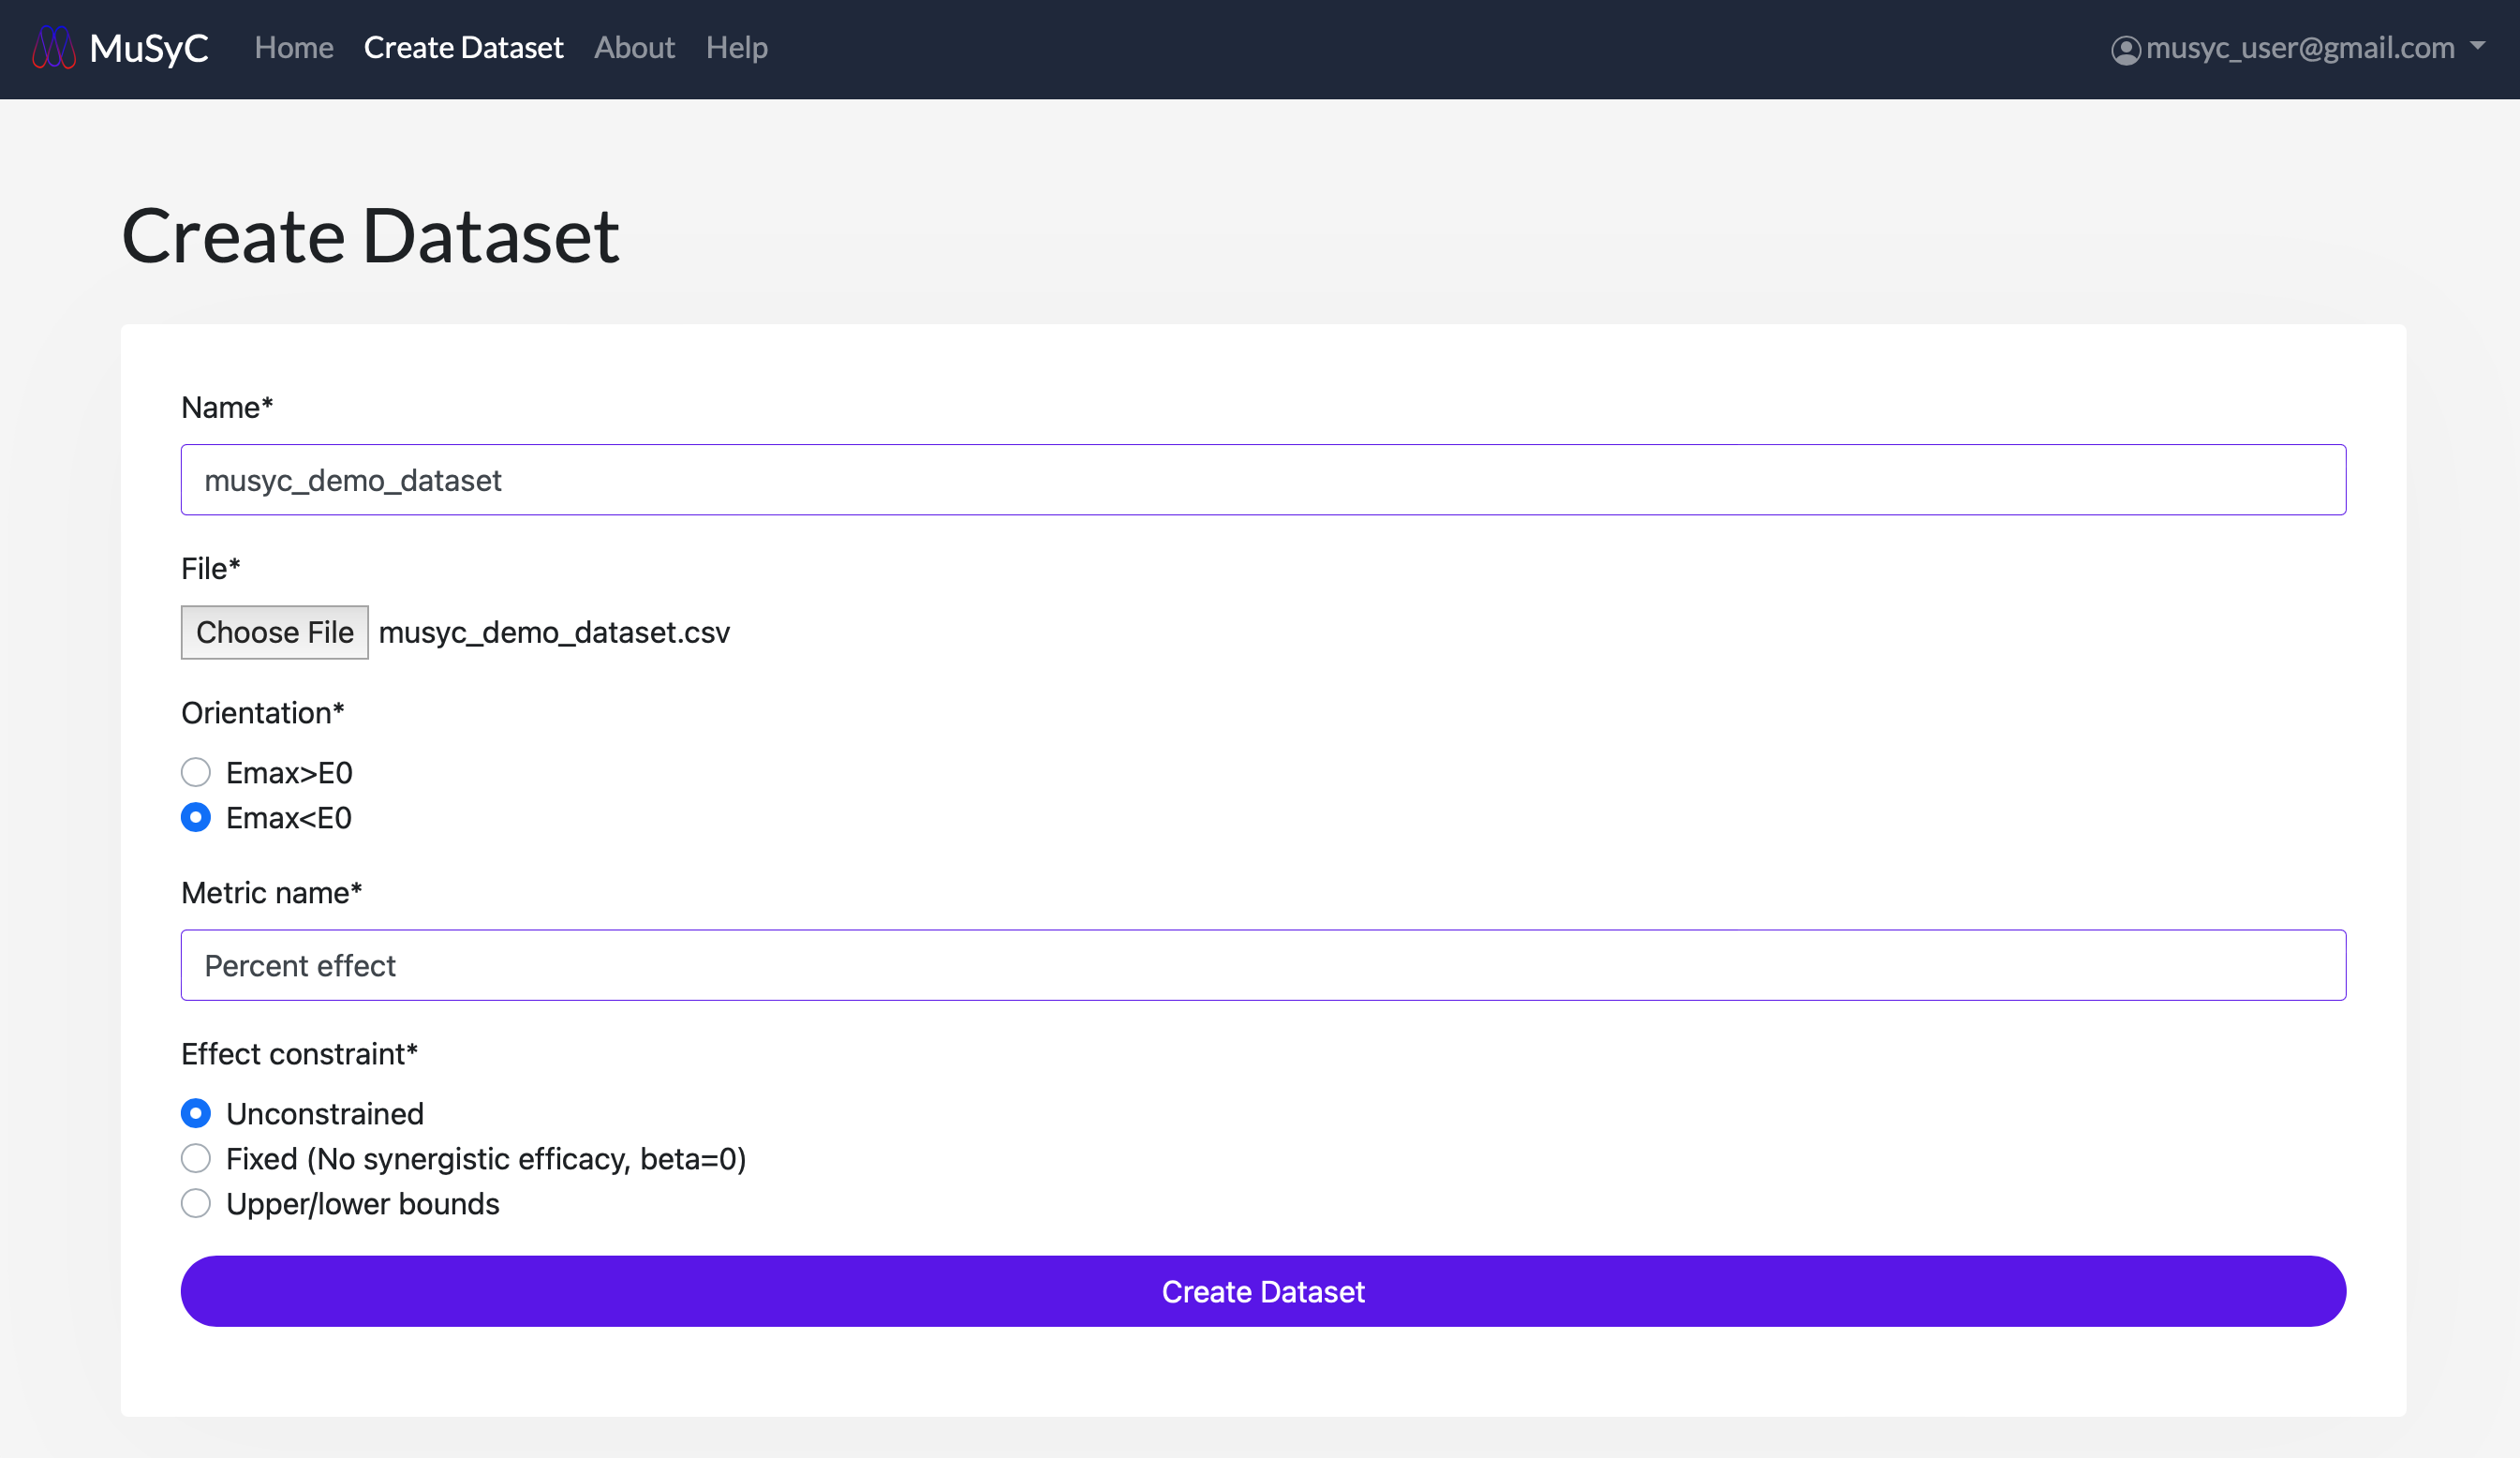
- Fill out the form with each of the following fields:
- Name: A name to refer to the dataset
- File: Select a CSV file from your computer, formatted as described above
- Orientation: Whether Emax > E0, or Emax < E0:
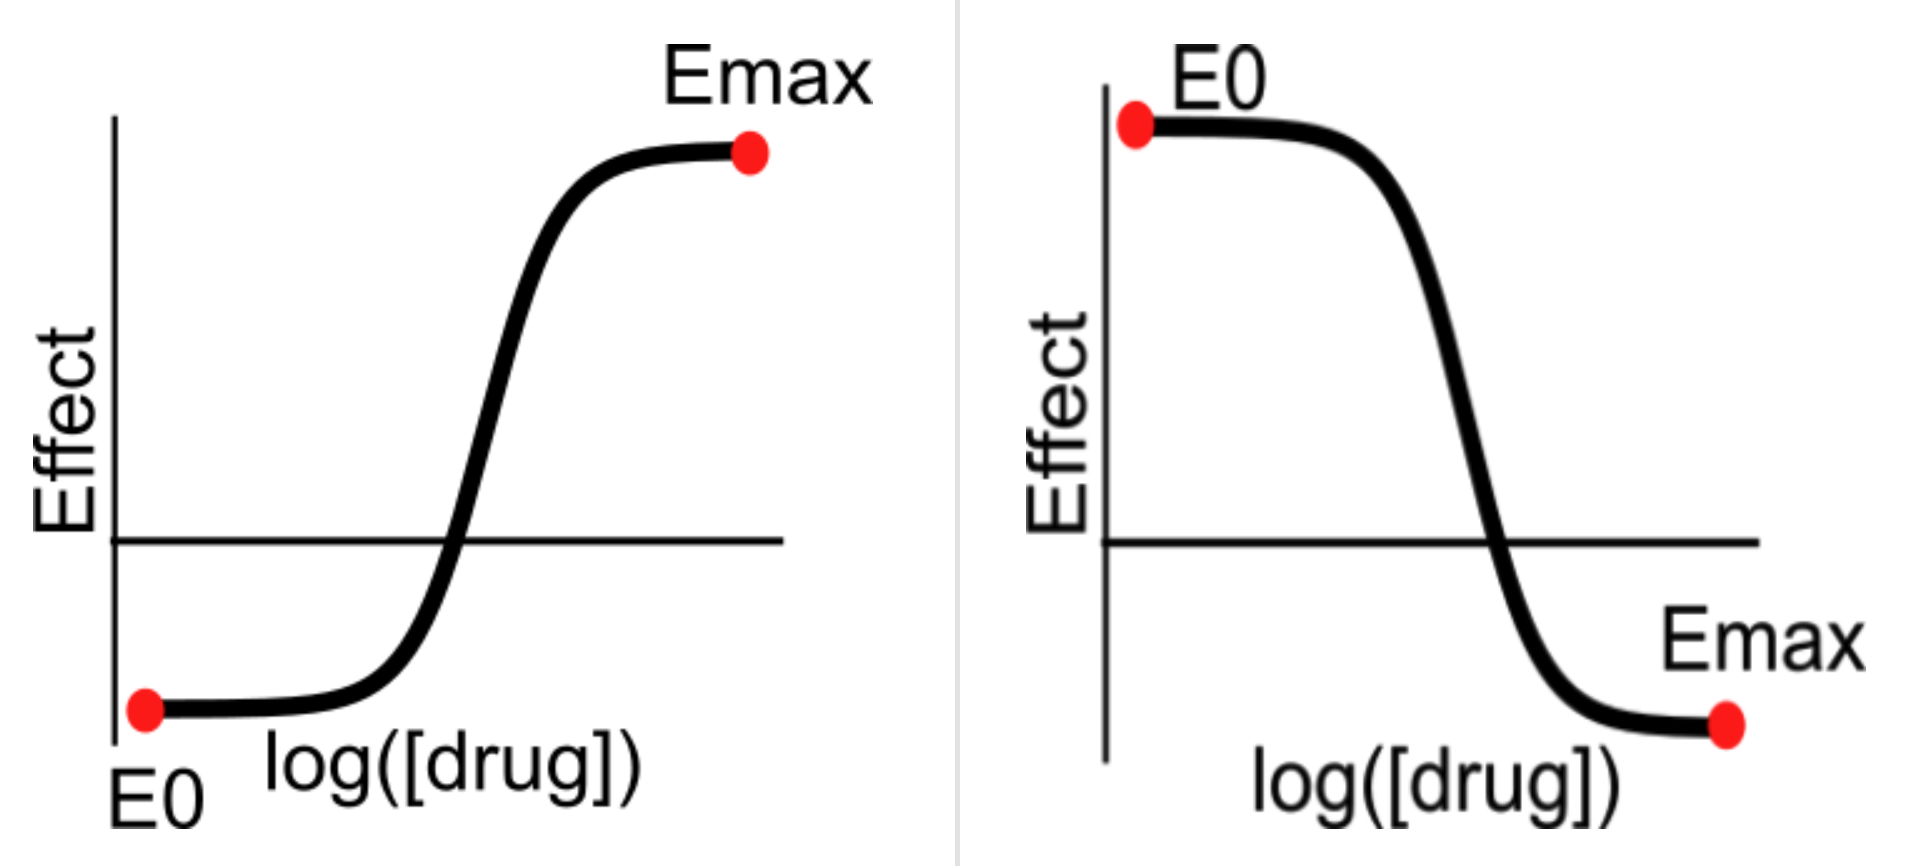 Above: Dose-response curves showing Emax > E0 (left) and Emax < E0 (right)
- Metric name: The name of the drug effect (e.g., "Percent effect" or "DIP rate").
- Effect constraint: Whether to fix or apply bounds to the E0 and Emax values.
- Unconstrained: Emax and E0 are determined empirically
- Fixed: Emax and E0 are specified manually. This implies no synergistic efficacy, i.e. beta=0. You can specify one fixed value and leave the other one unconstrained (blank) if desired.
- Upper/lower bounds: Specify range bounds for Emax and E0. You can provide lower, upper, or both bounds, for either or both of Emax or E0. Leave blank for unconstrained.
- 3
- After submitting the form, the file should start uploading and the browser will be redirected to the processing page.
MuSyC loads the file into its database, calculates the synergy of the drug combinations, and fits a
dose-response surface and dose-response curves. This may take several minutes.
Note: Do not navigate away from the page while the upload is in progress.
- 4
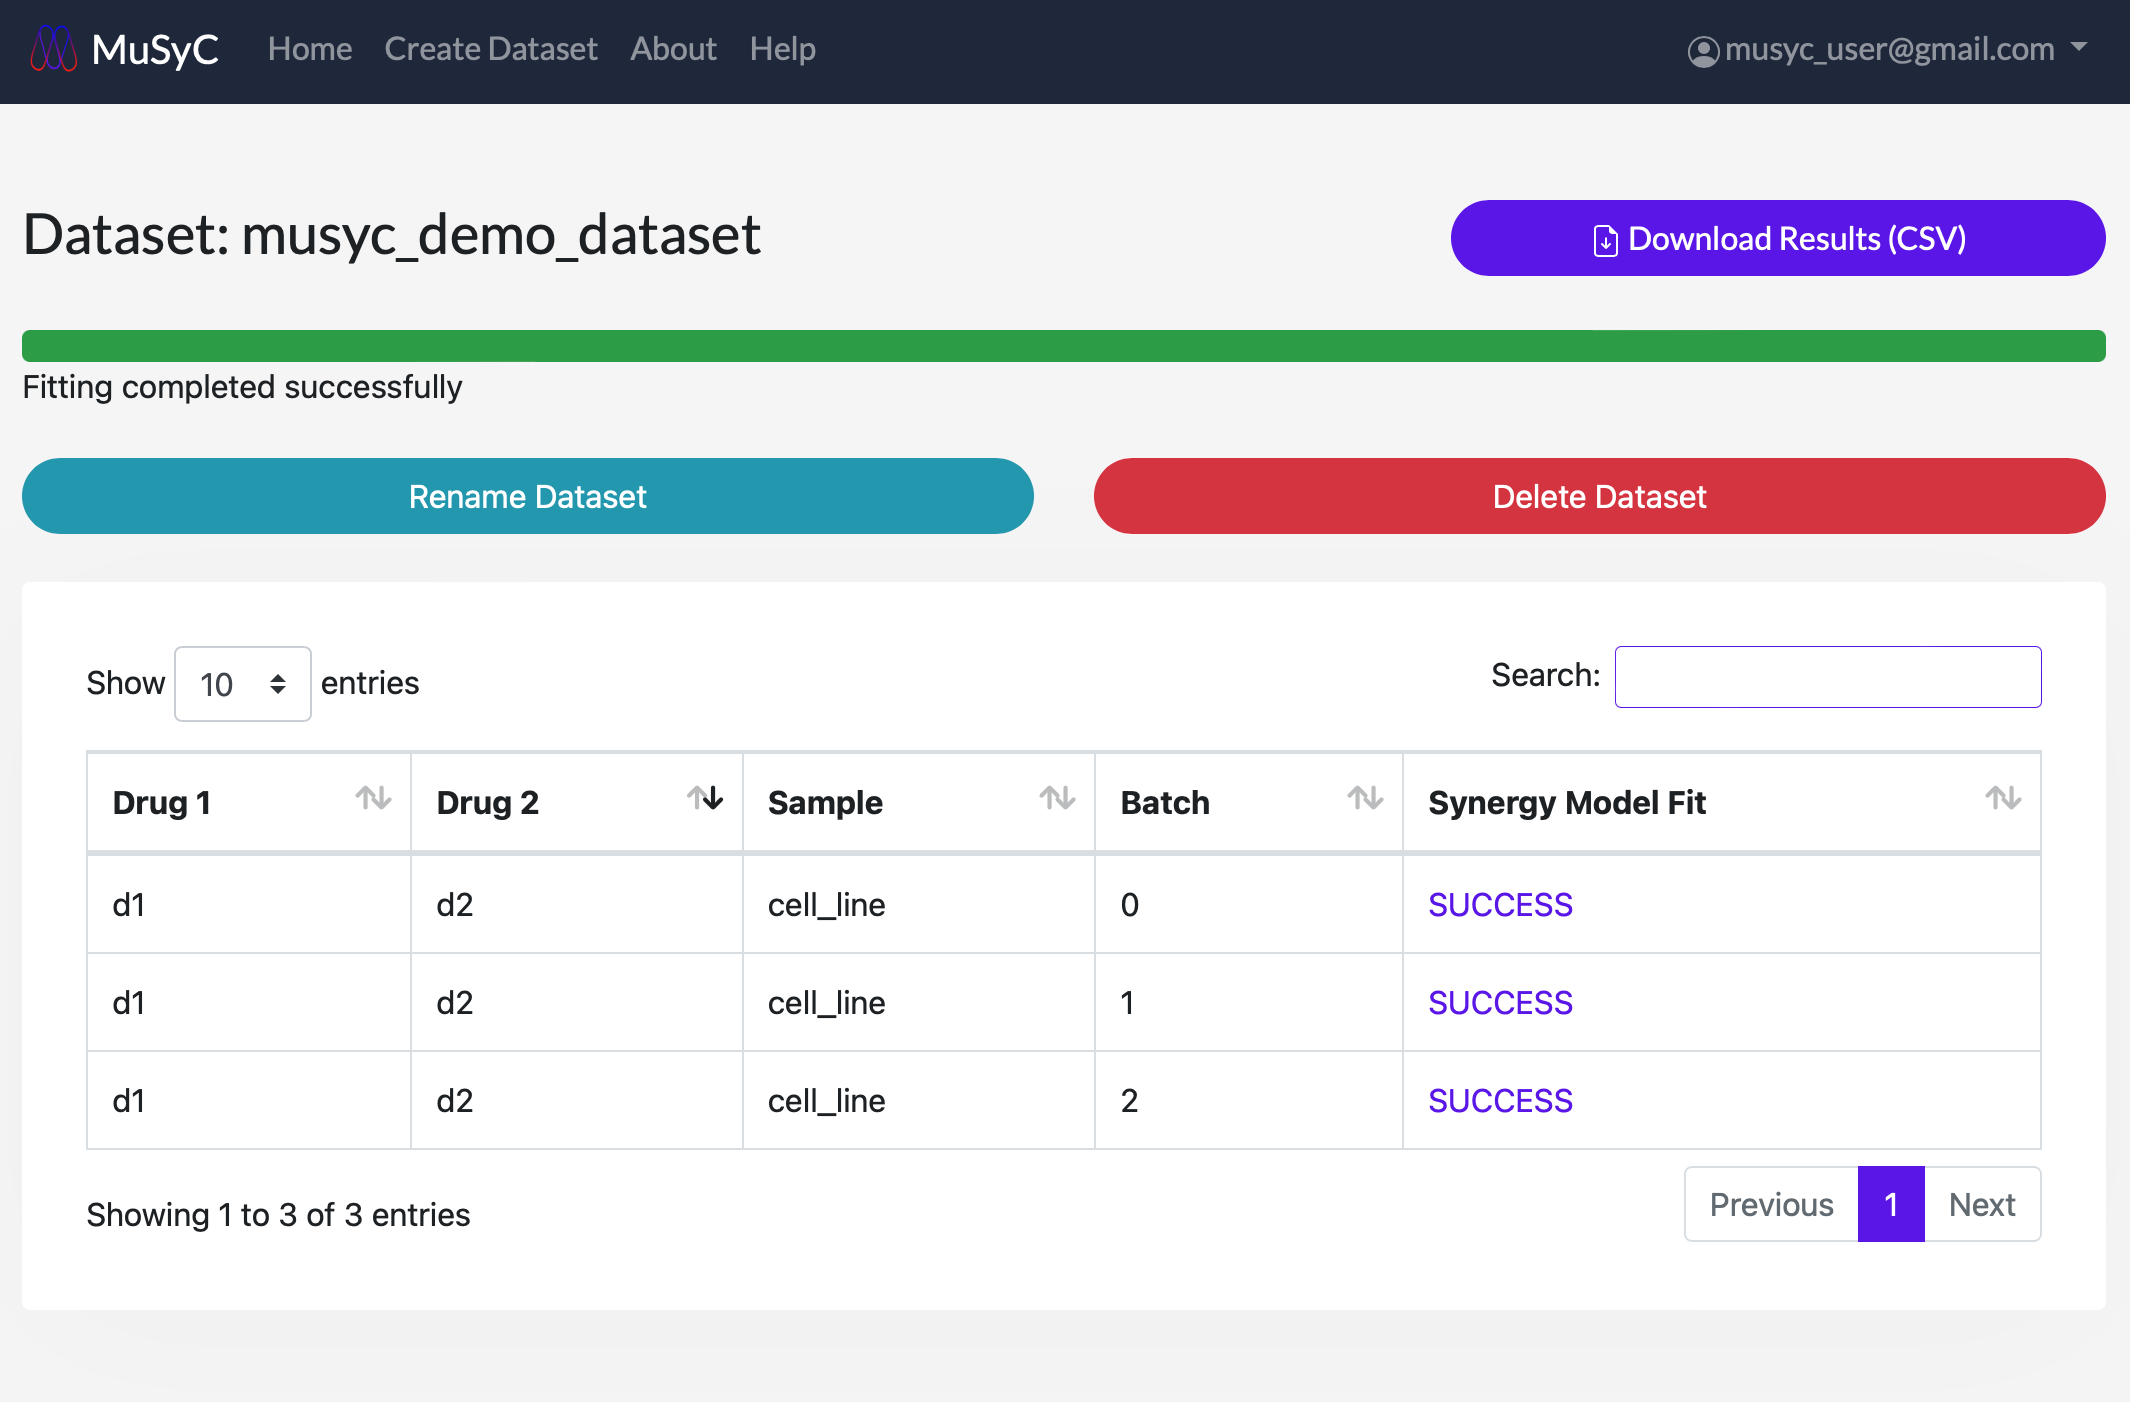
- View the progress of the synergy calculations and model fitting using the progress bar at the top of the dataset page. The status of each combination can be seen in the Synergy Model Fit column as QUEUED, STARTED, FIT COMPLETE, or FAILED. At the top of the page, there is a Download Results (CSV) button to download the dataset's fitting parameters as a CSV file (see Synergy Parameter Plots for more details).
Dataset Page Layout
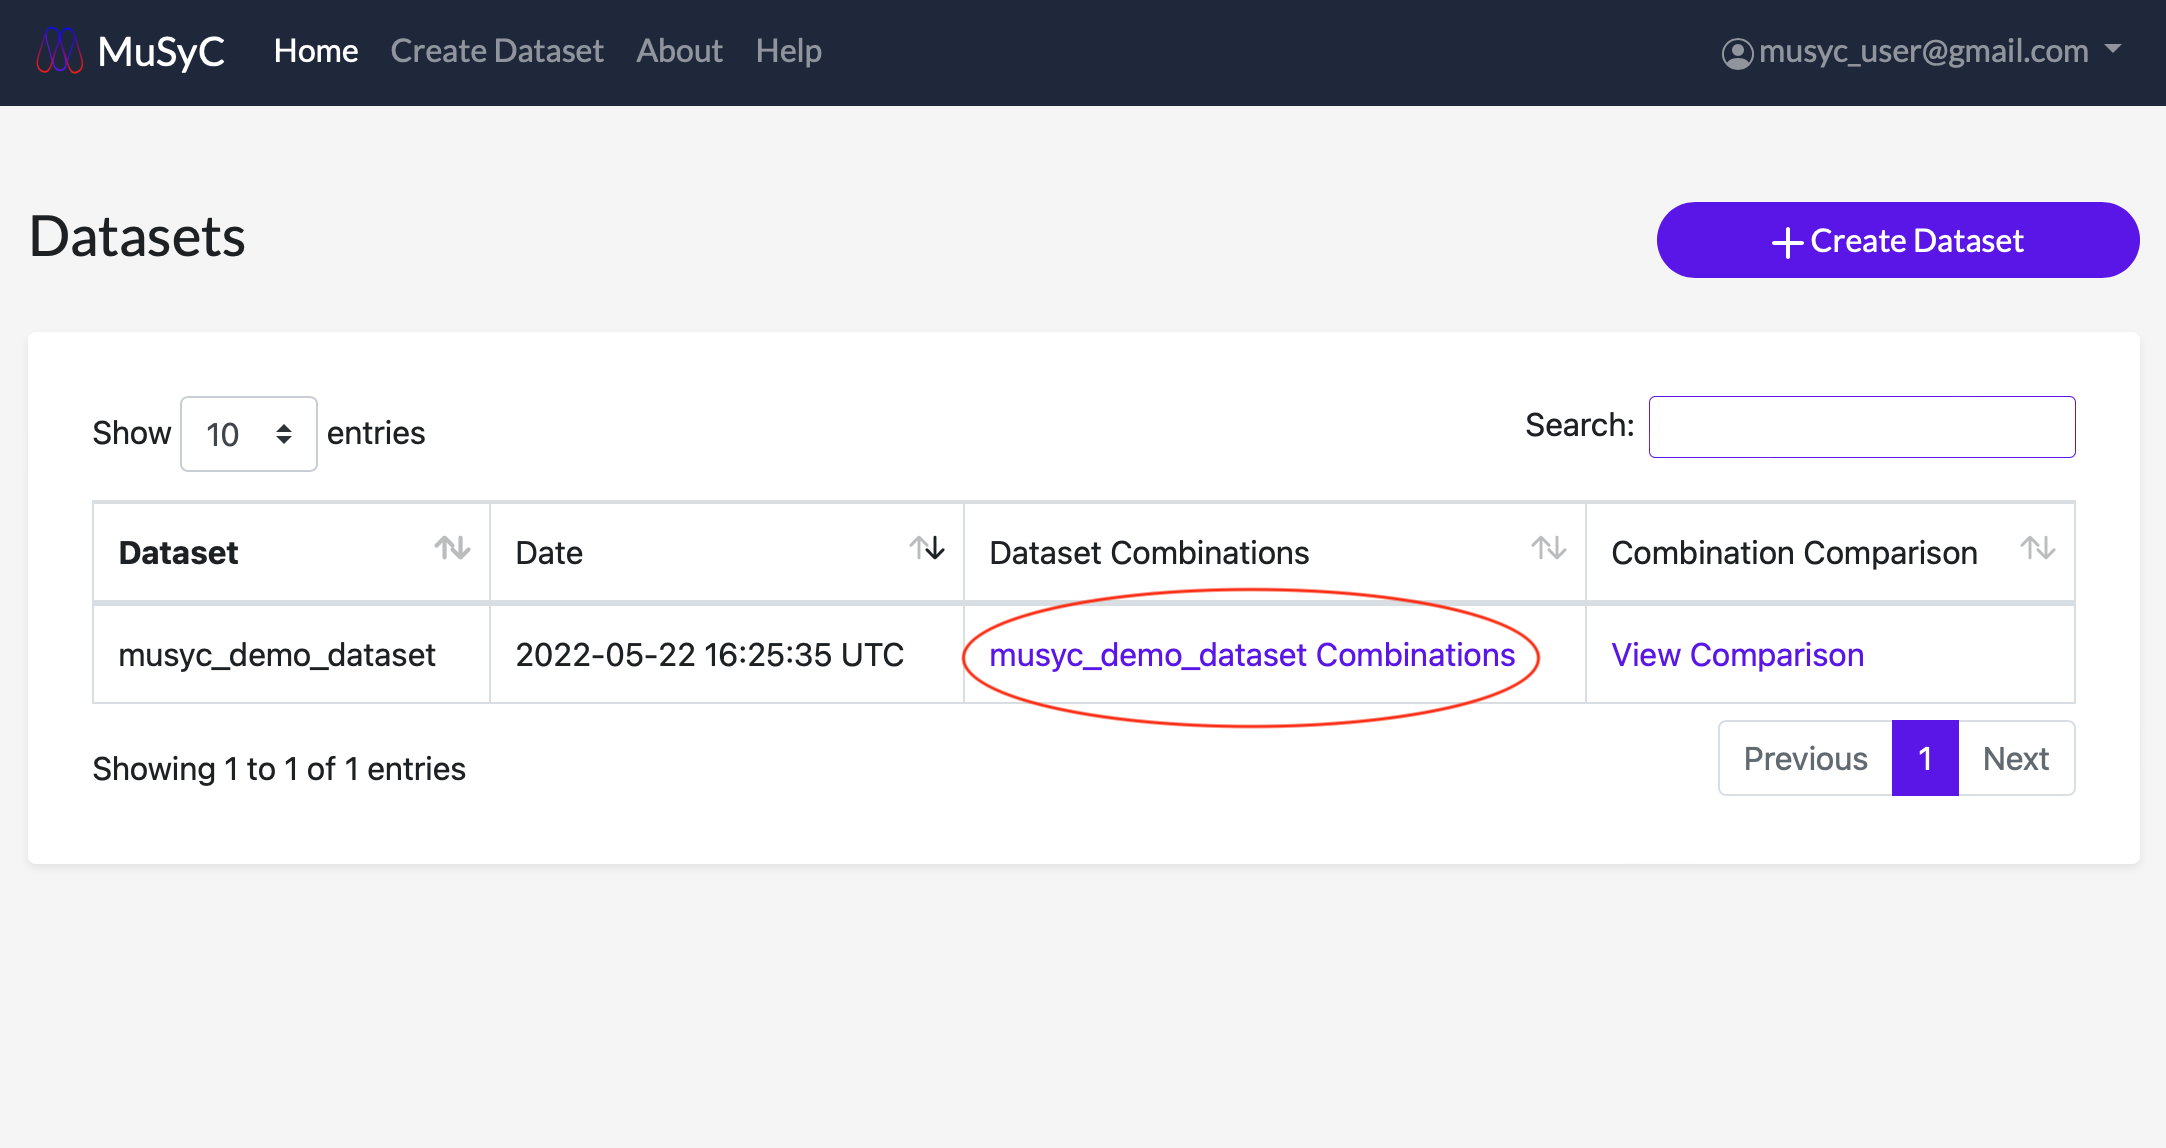
You can return to the combination fits page at any time by clicking the links in the Dataset Combinations column in the dataset table.
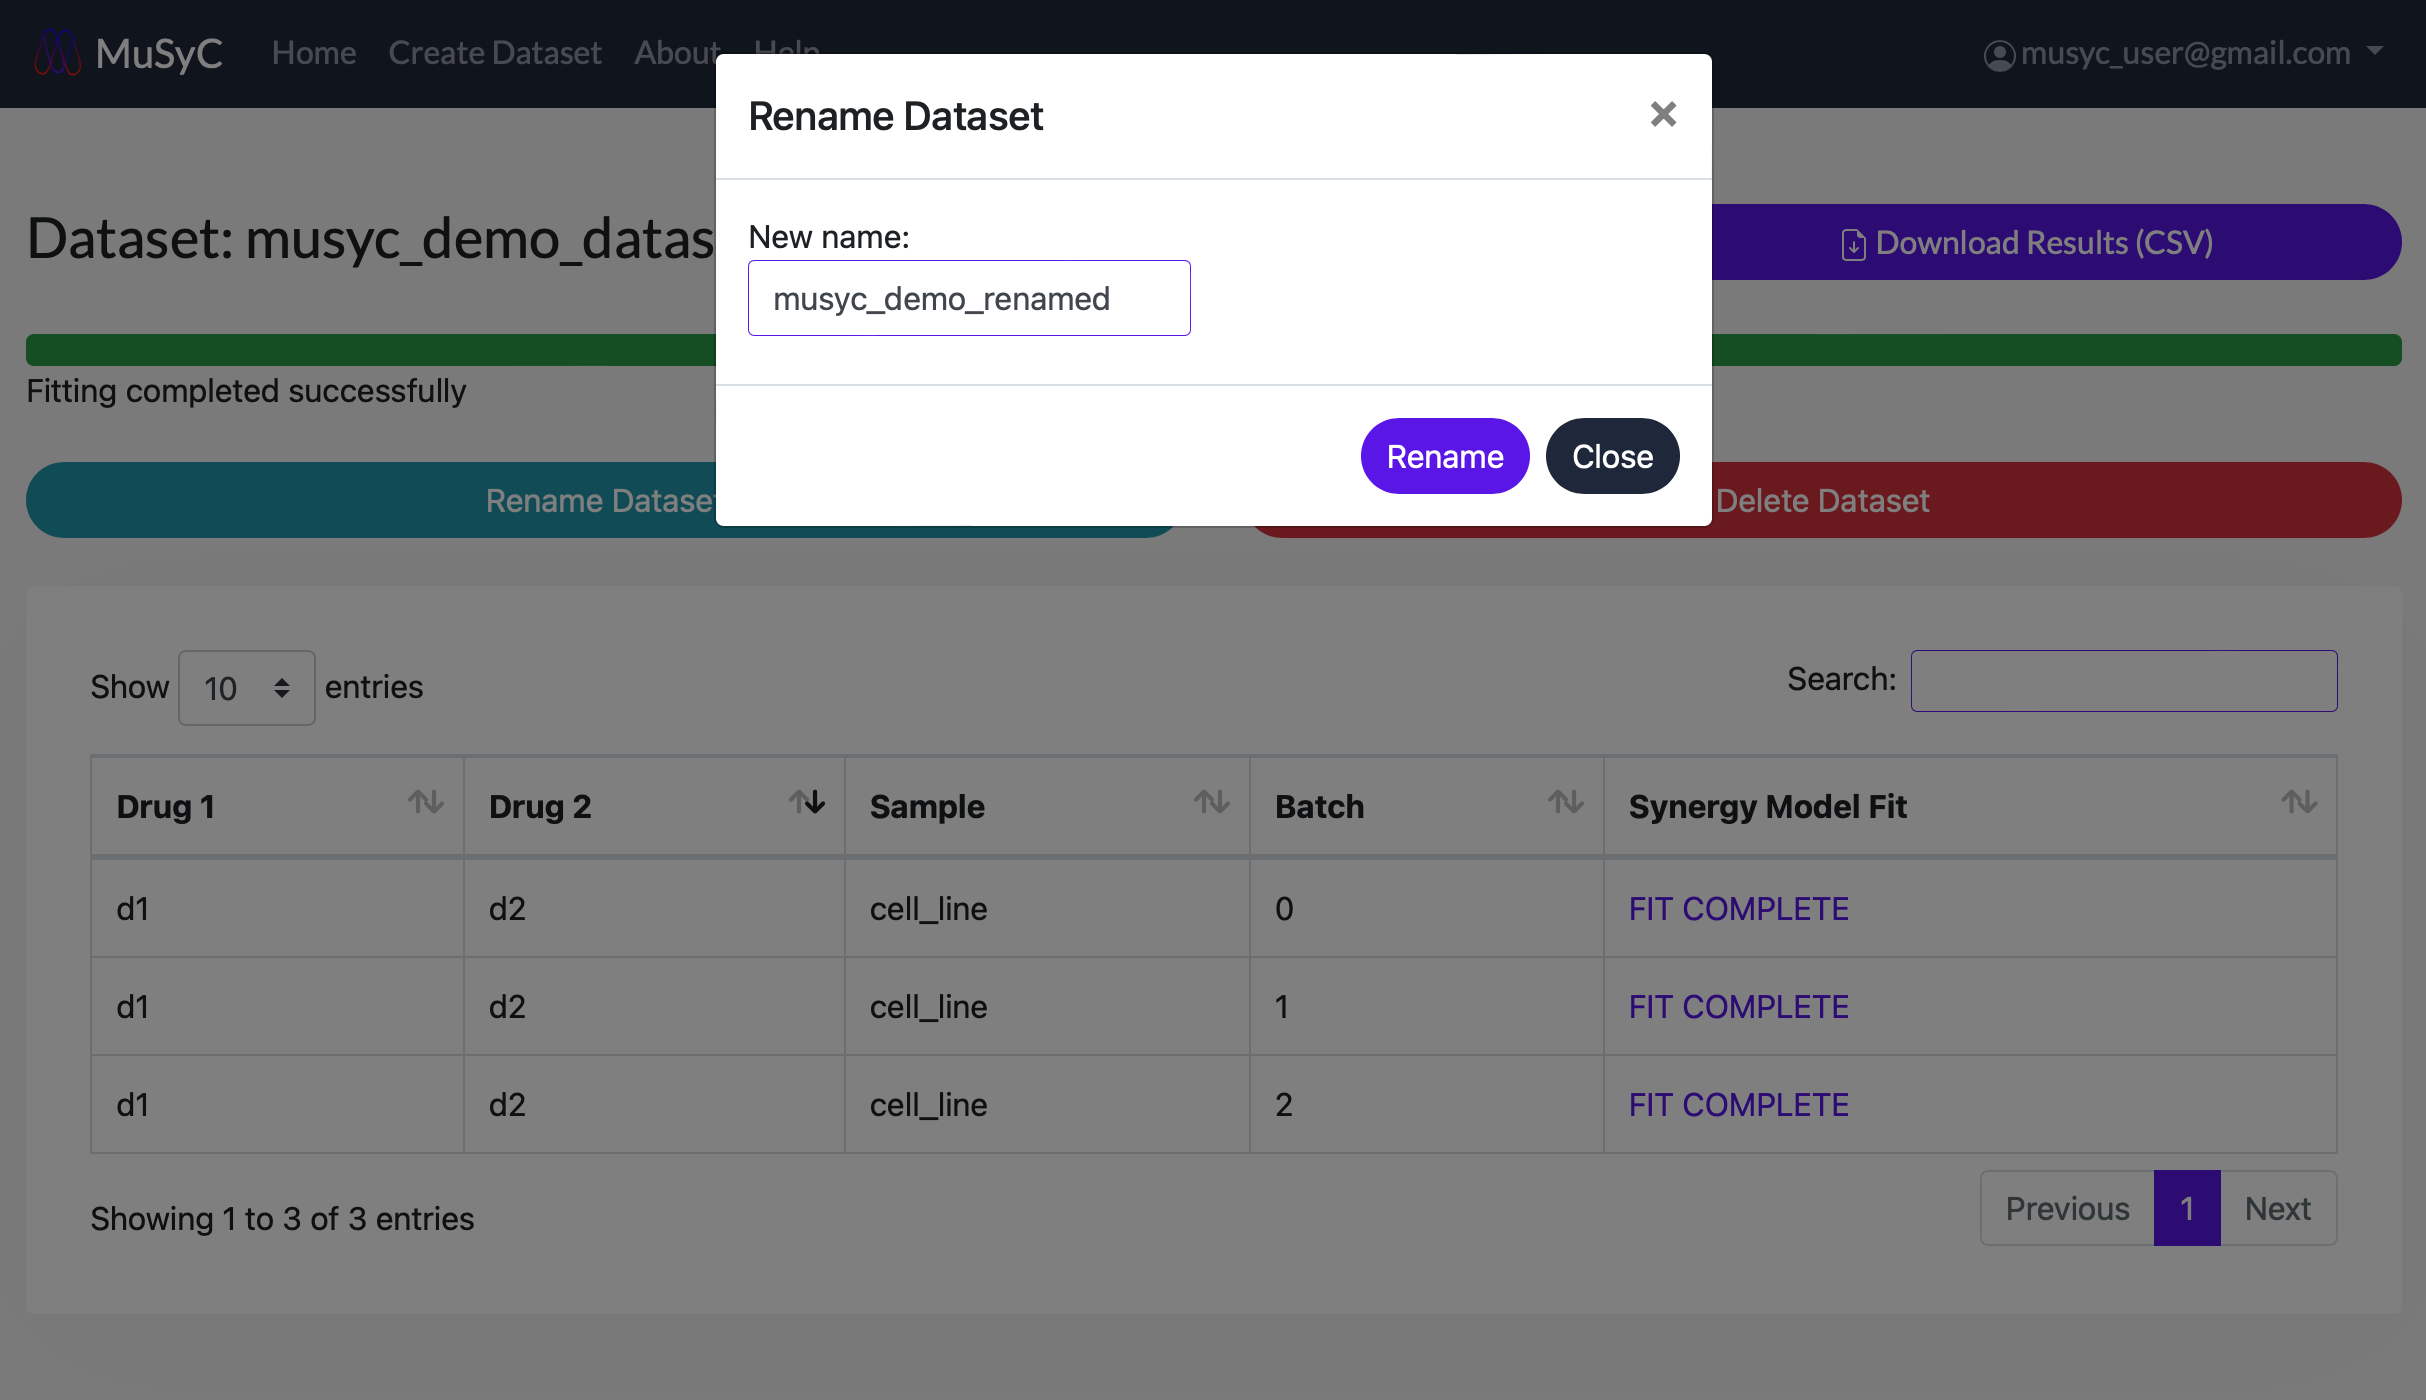
Rename / Delete a Dataset
Edit- 1
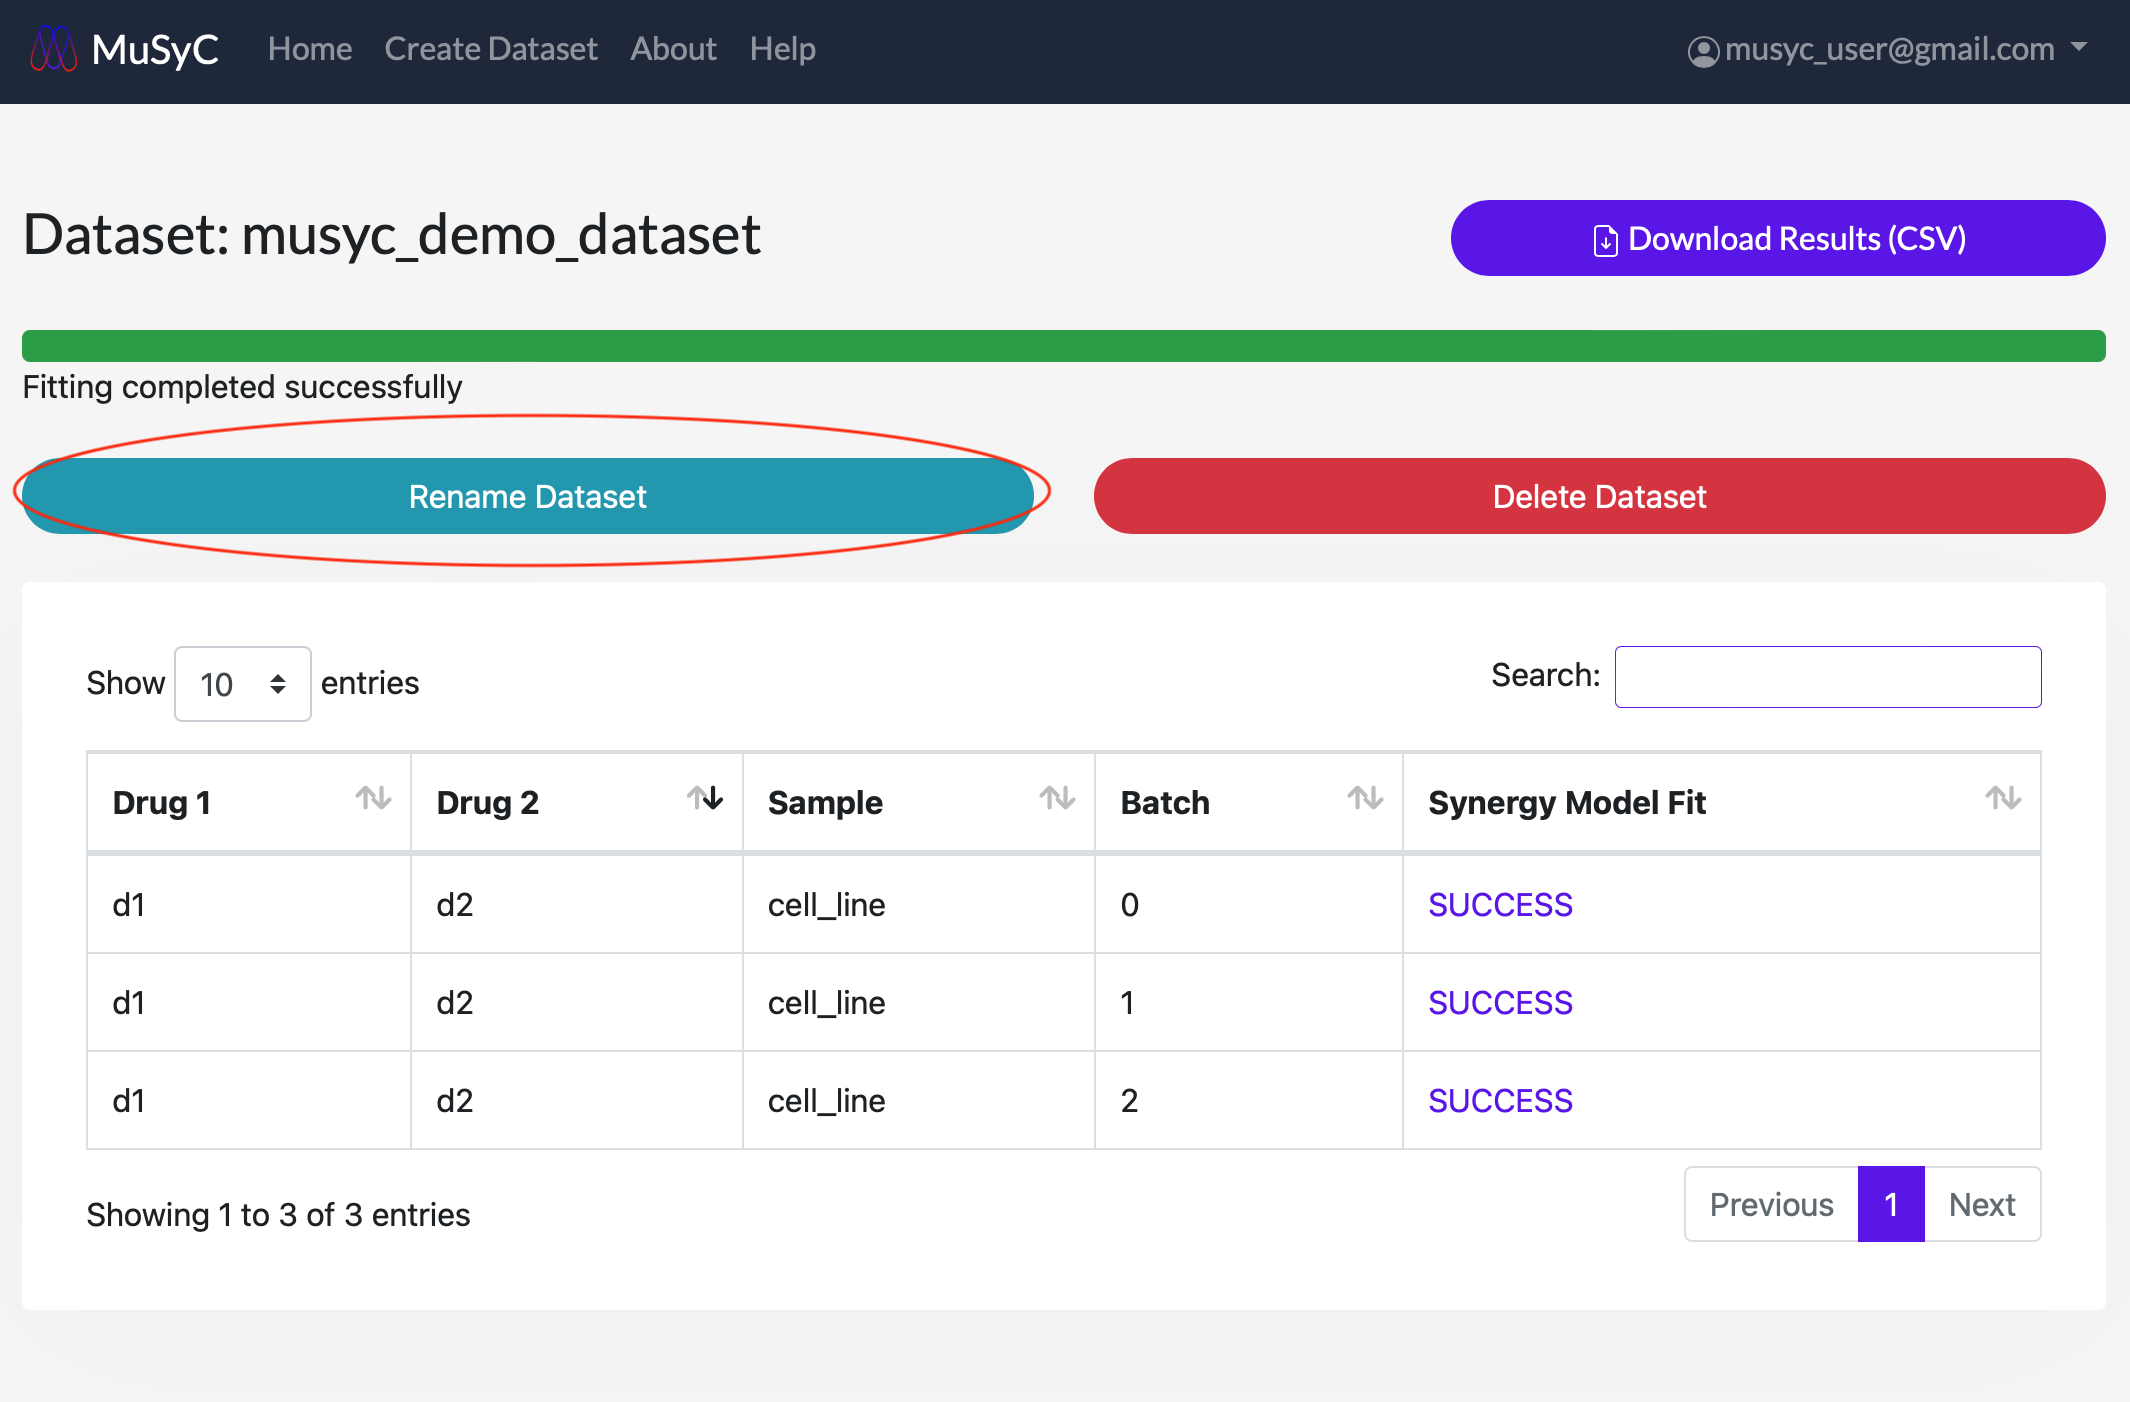
- Click on the Rename Dataset button to open the rename dataset form. Enter a new name and click
Rename to submit.
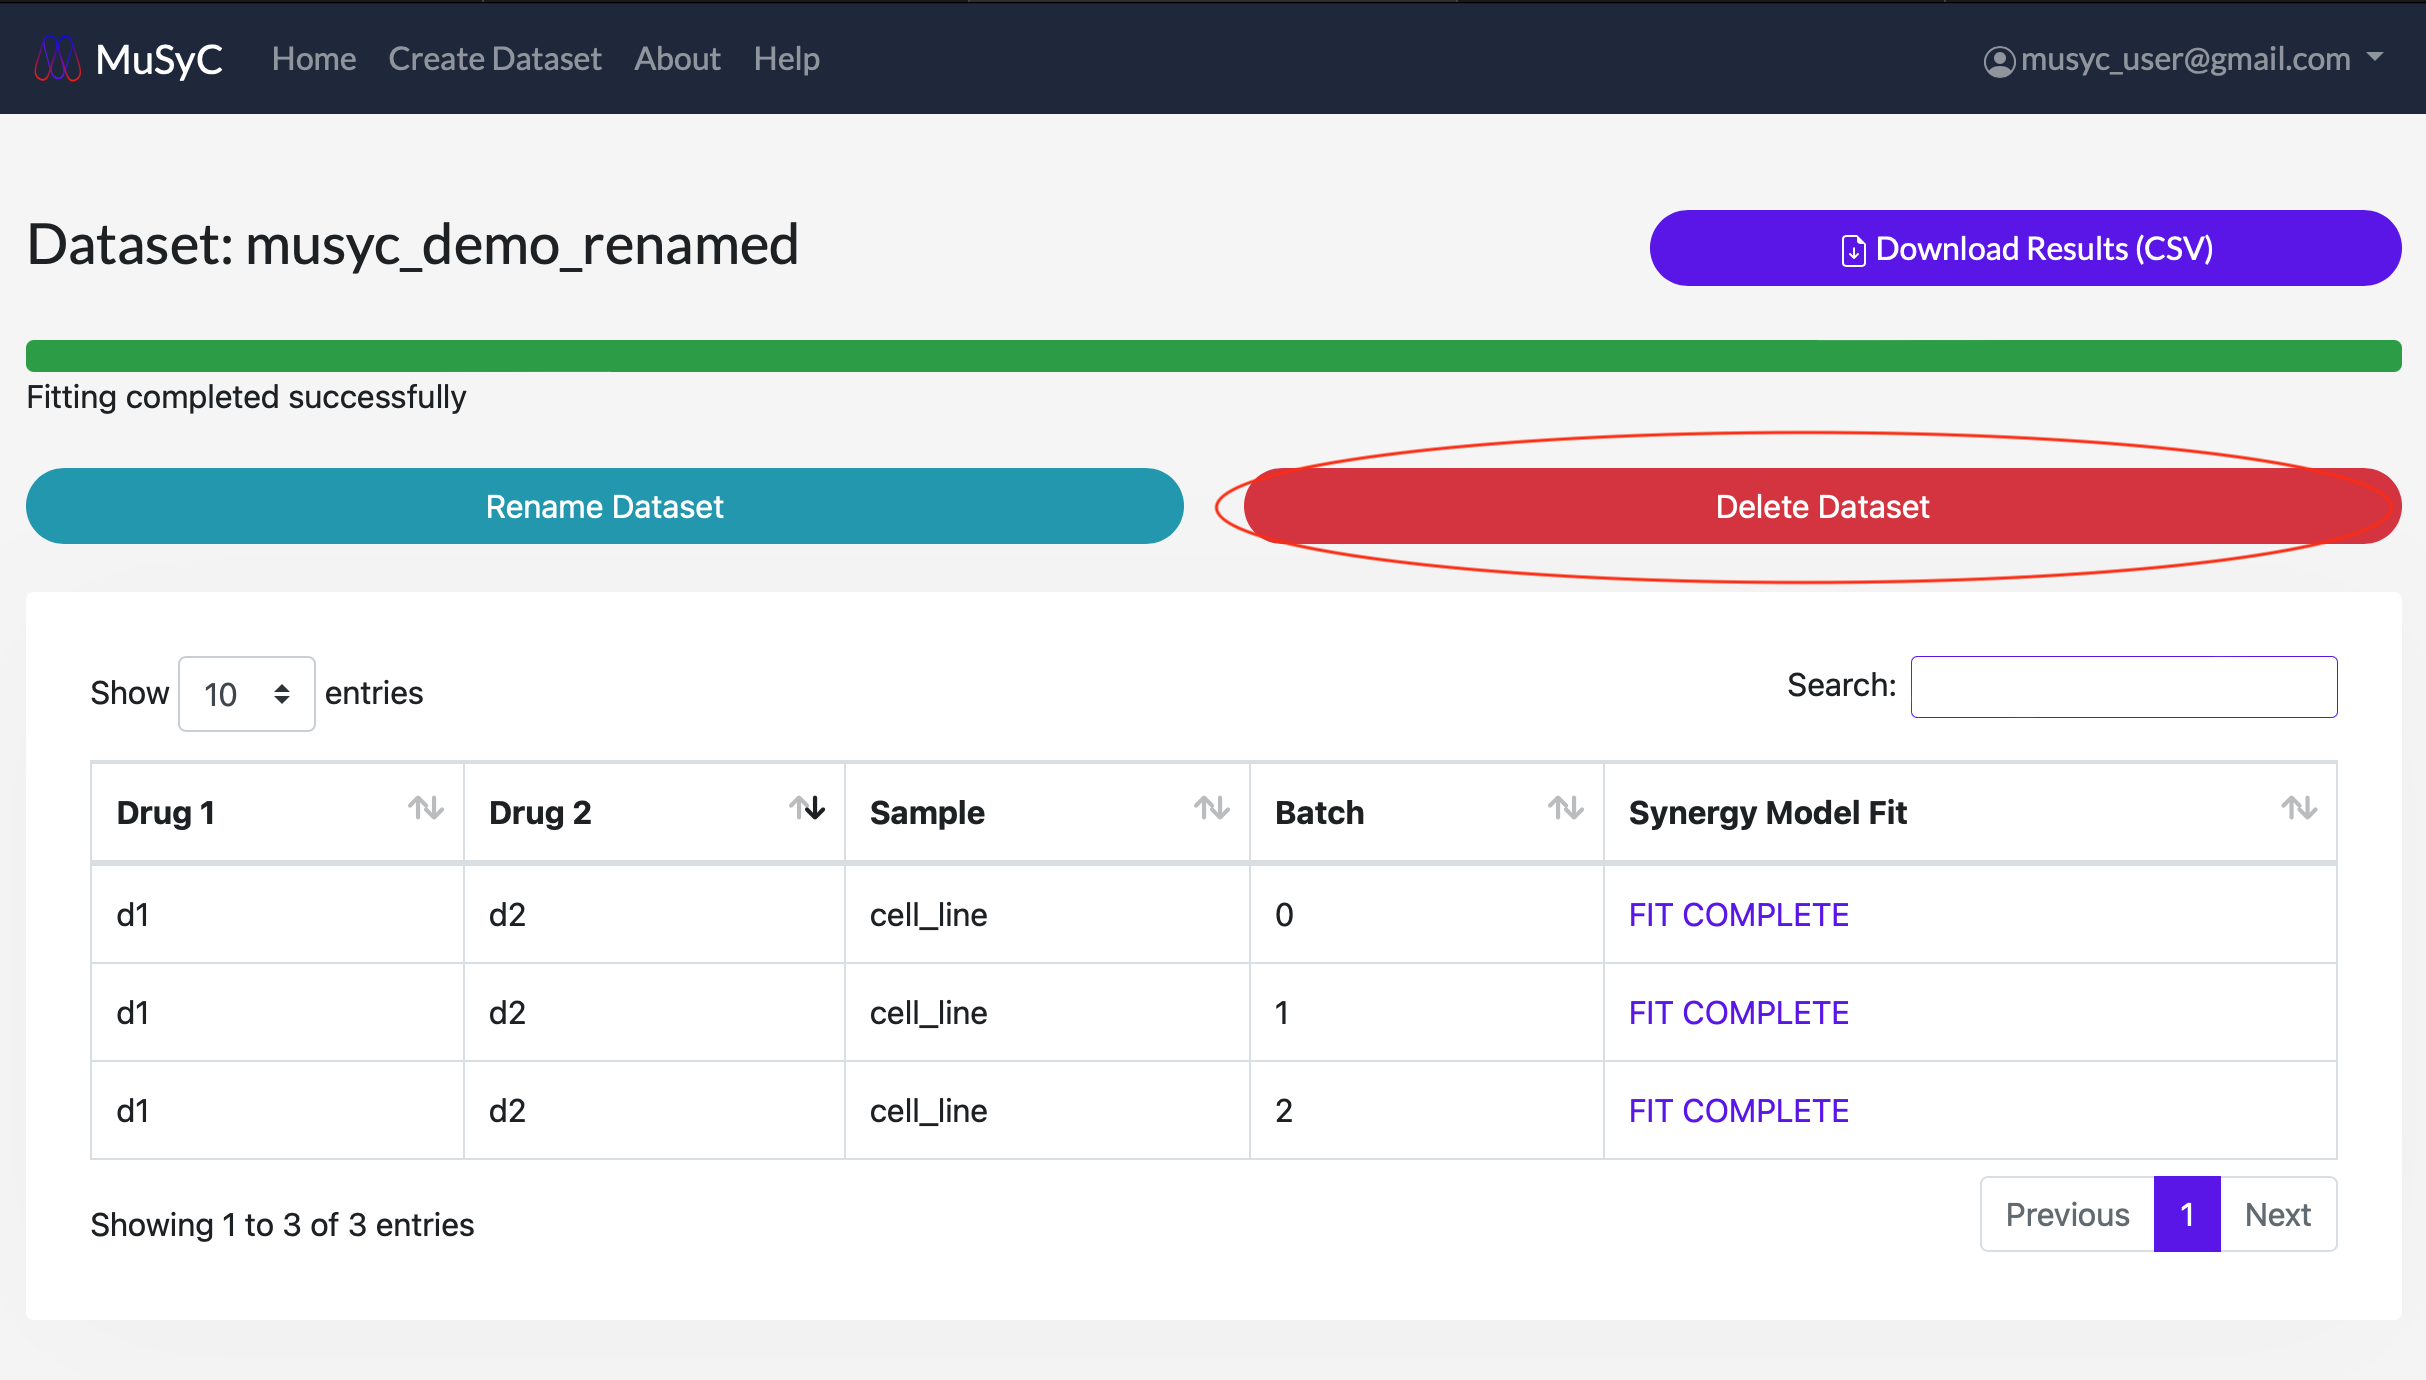
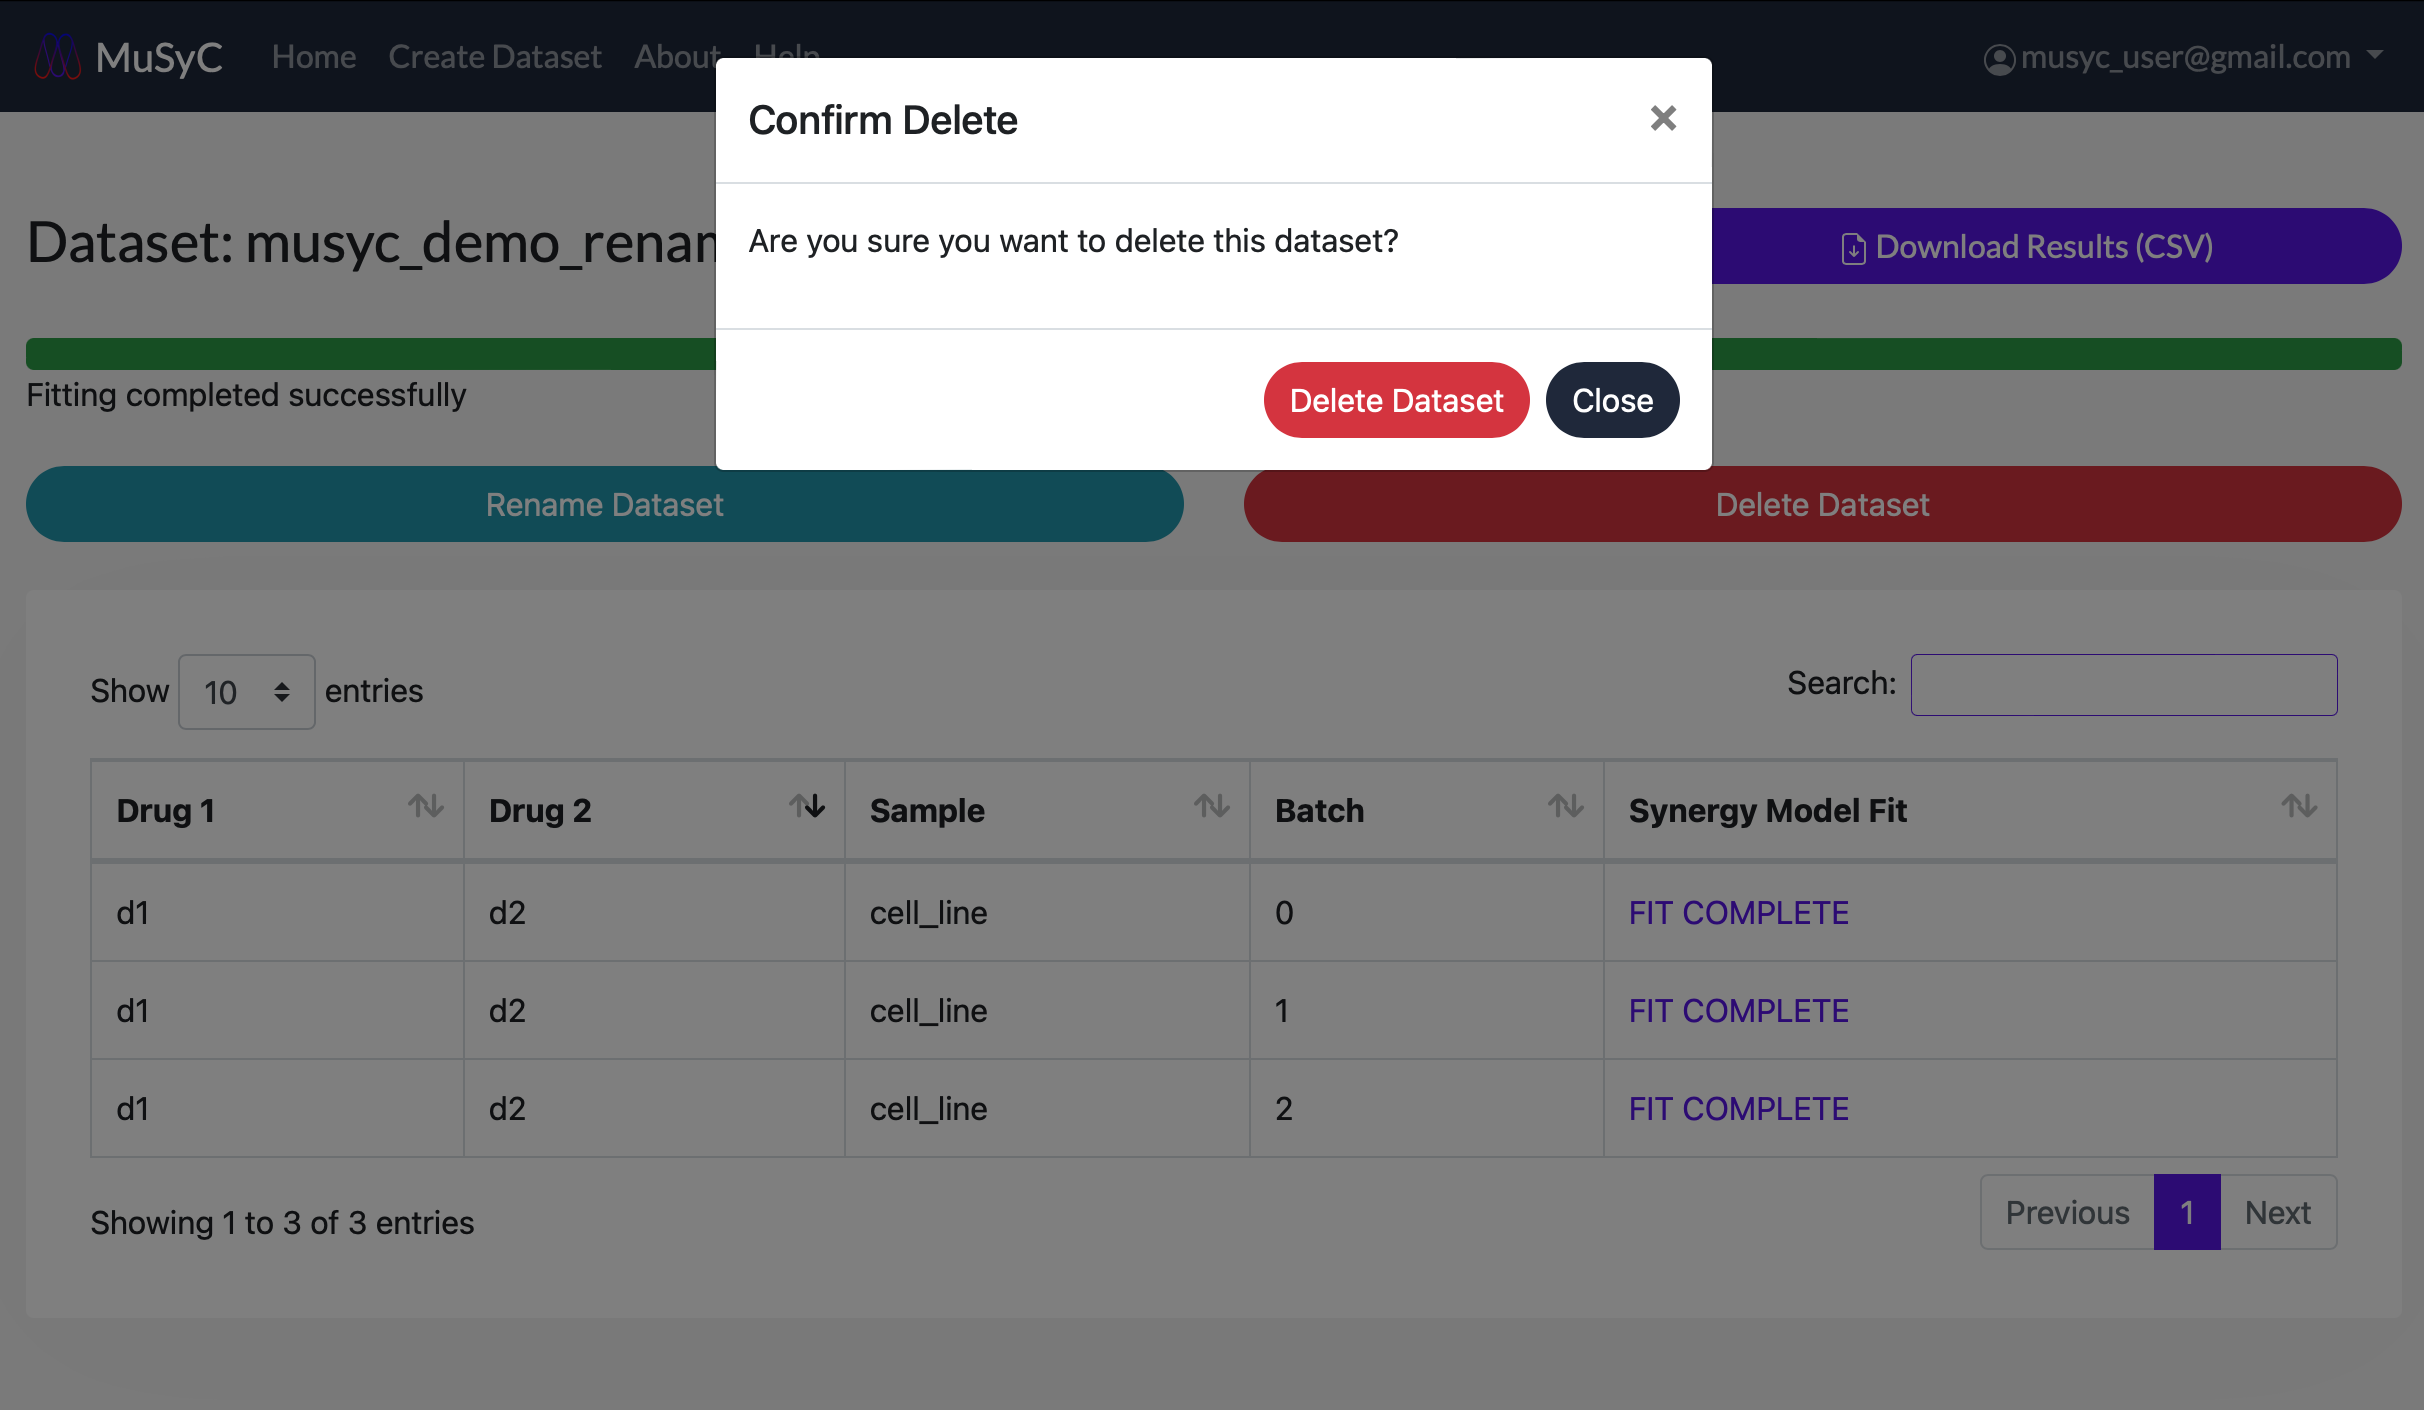
- 1
- Click on the Delete Dataset button. A popup will appear to confirm the deletion.
Click Delete Dataset to permanently delete the dataset. Click Close if you
do not wish to delete the dataset.
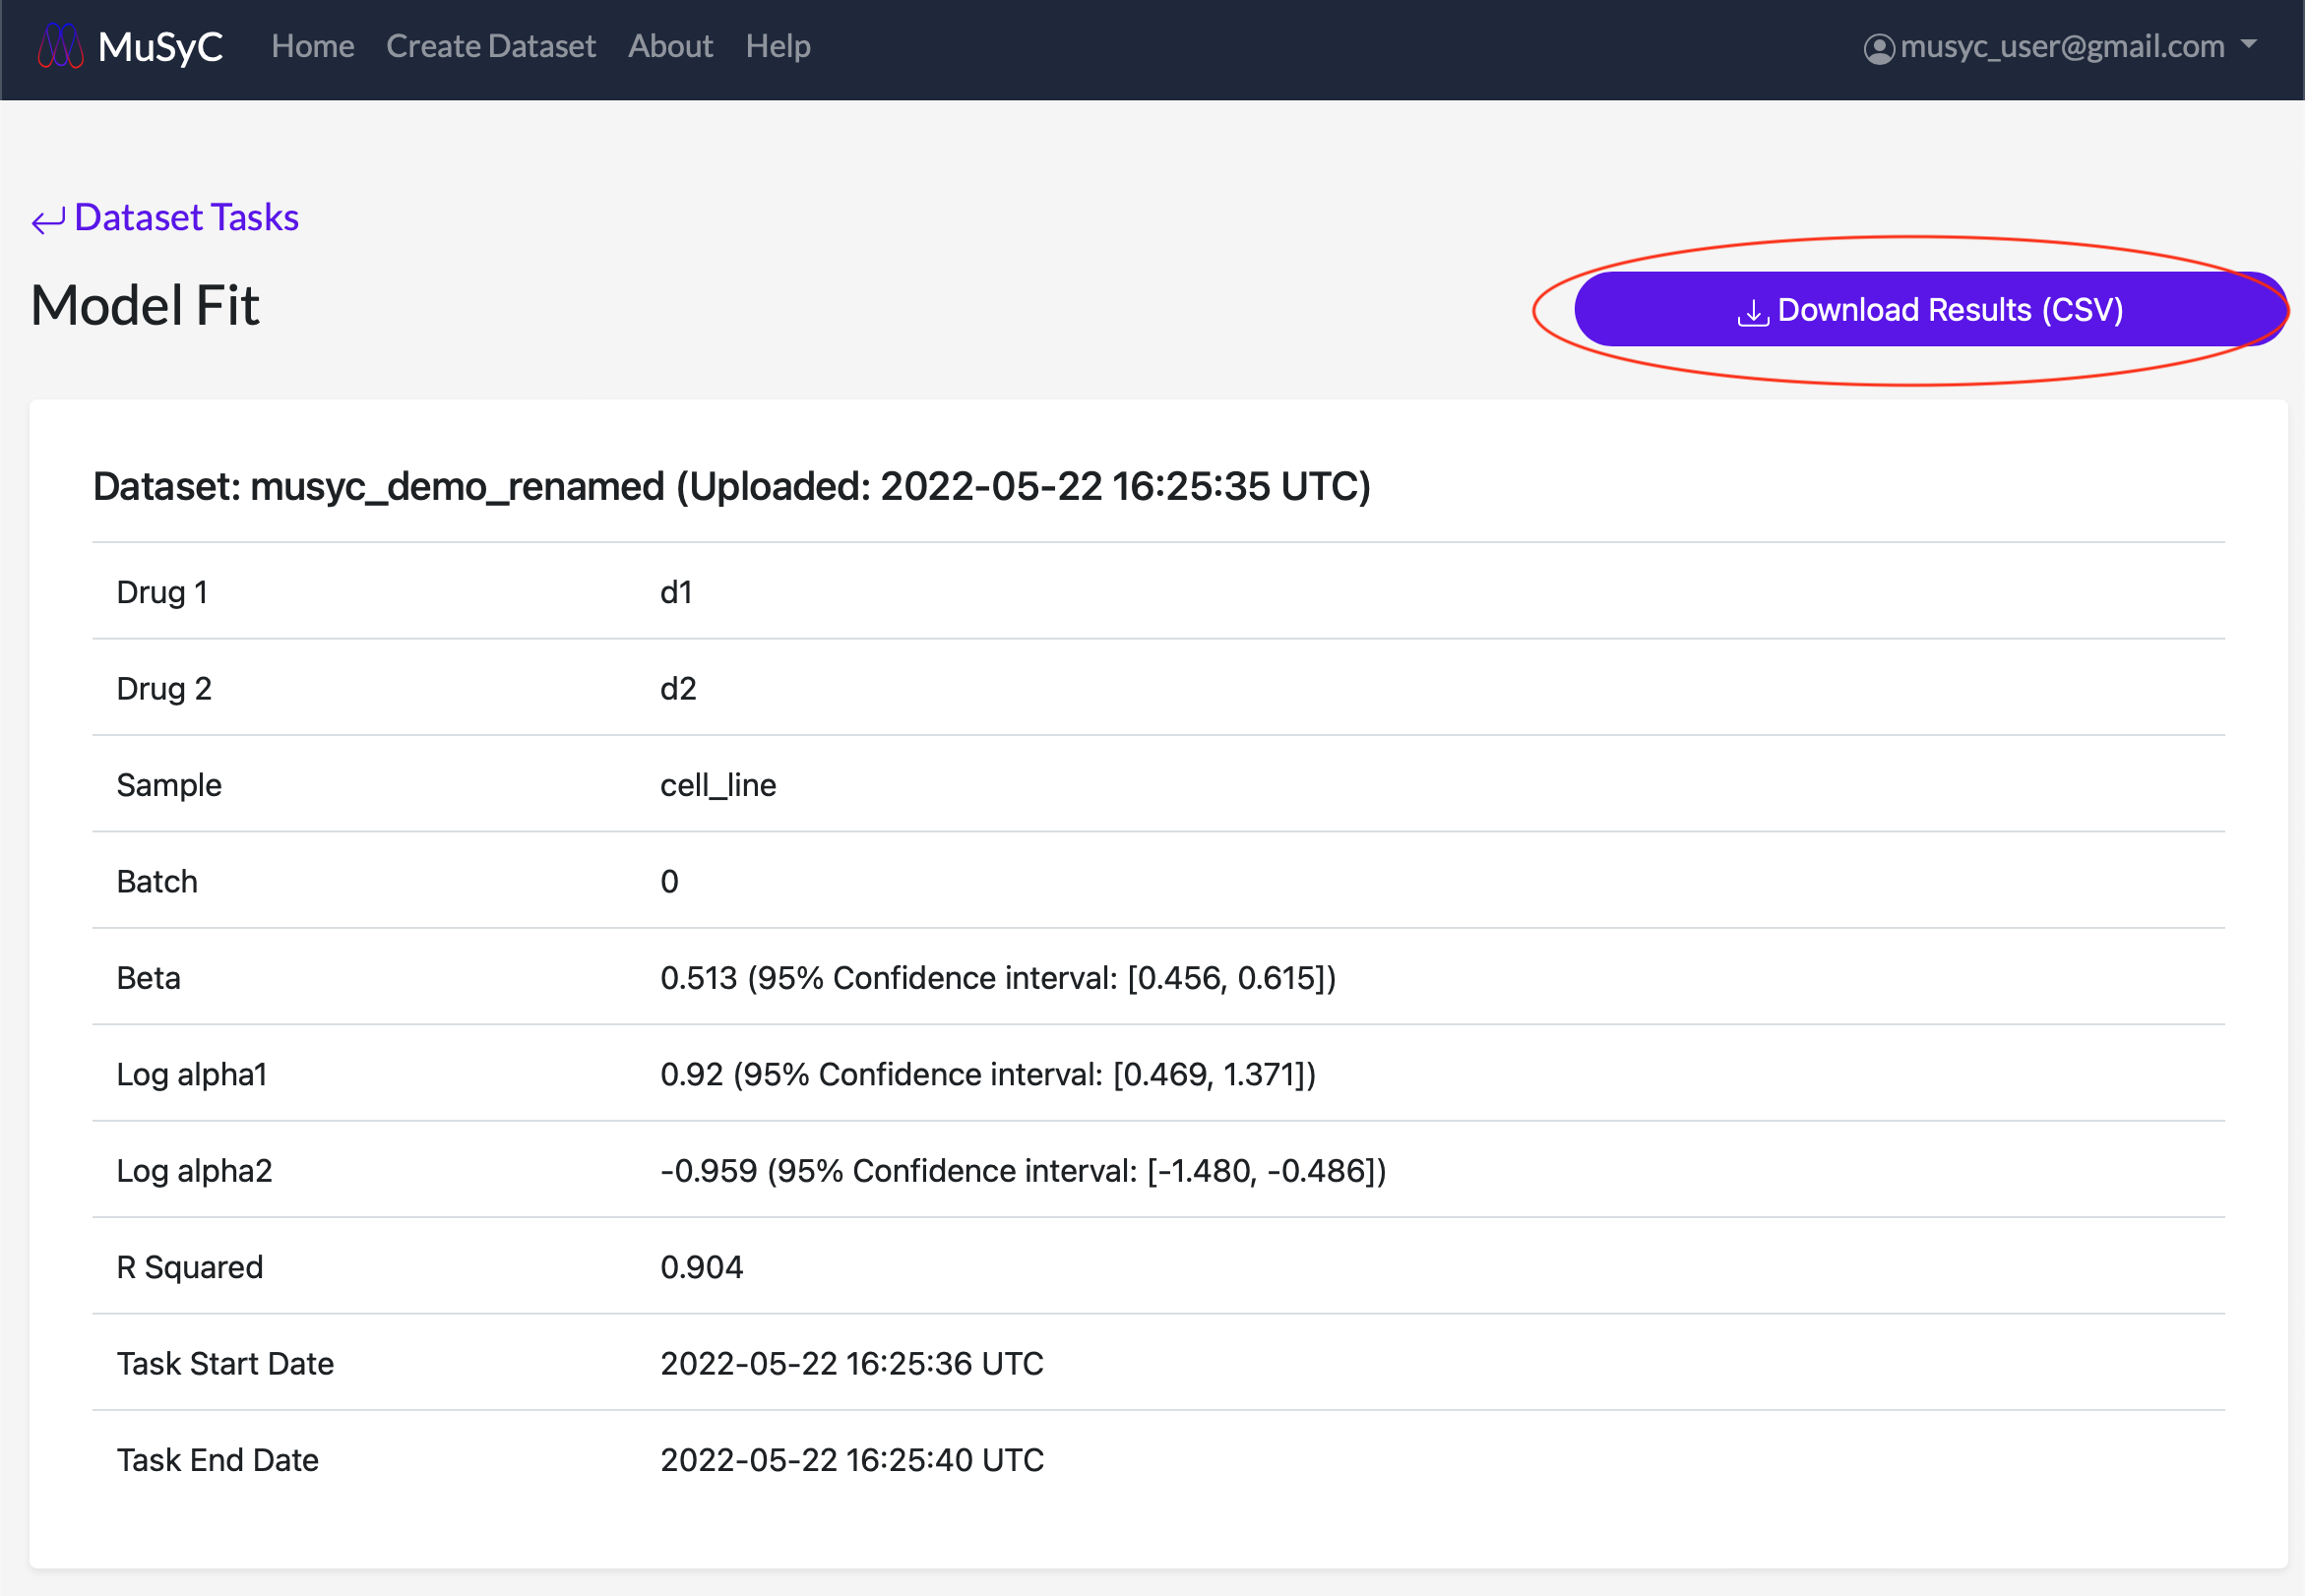
Synergy Model Fit
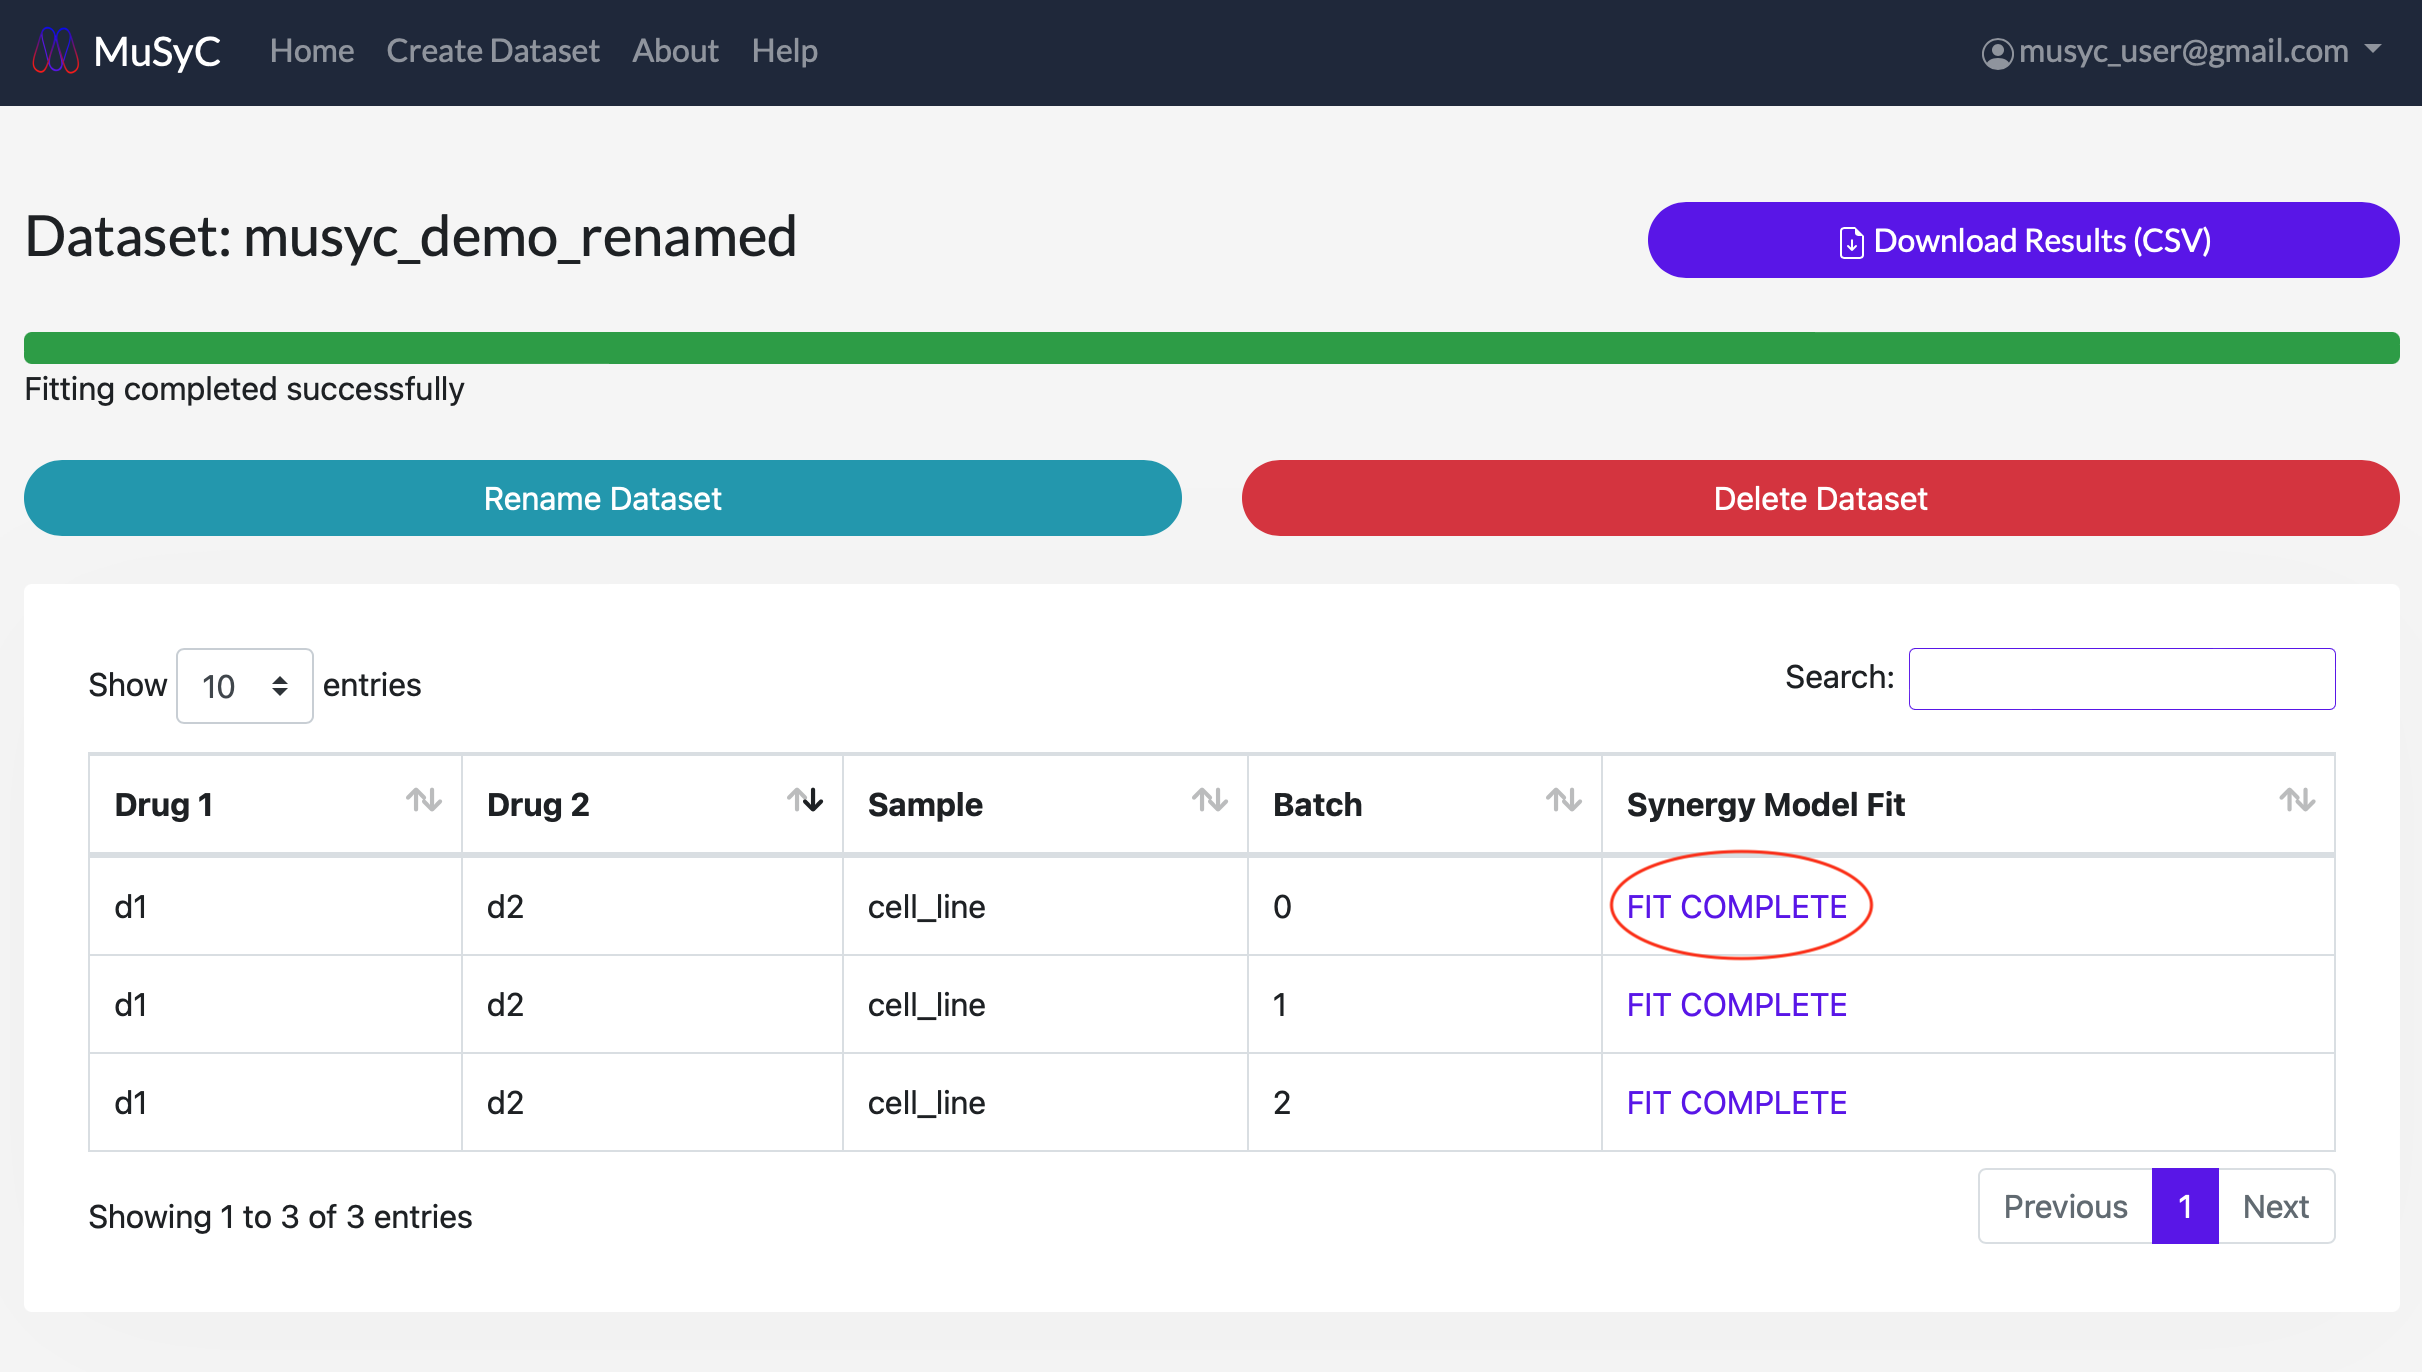
View Synergy Fitting Results
Each drug combination dataset task table shows the fitting algorithm's status (e.g., queued, started, fit complete, failed) under the 'Synergy Model Fit' column. For successful tasks, clicking on the FIT COMPLETE will show the parameters for that combination, along with an interactive dose-response surface plot and dose-response curve plots. These plots can be zoomed, panned, and rotated in the web browser. For tasks marked as FAILED, clicking on that word will show more details about the error (e.g., if there was a data validation issue that the user should correct).
At the top of the page, there is a Download Results (CSV) button to download the combination's fitting parameters as a CSV file. The table at the top of the page displays a subset of these parameters.
Parameter CSV File
The following table gives a description of each of the fields in the output parameter CSV files.
Output Data Format
| Parameter | Description |
|---|---|
| sample | Sample name |
| drug1_name | Name of compound 1 (d1) |
| drug2_name | Name of compound 2 (d2) |
| expt | Name of experiment |
| batch | Name of the batch (if applicable) |
| task_status | Did the task succeed? |
| converge_mc_nlls | Did the Monte Carlo sampling converge? (1=True) |
| beta | The % increase of in the effect of the combination over the most efficacious single agent (based on fitted Emax). Beta = (min(E1,E2)-E3)/(E0-min(E1,E2)) |
| beta_ci | The 95% confidence interval for beta based on Monte Carlo sampling |
| beta_obs | The observed % increase of in the effect of the combination over the most efficacious single agent (based value of fit at max tested conc.). Beta_obs = (min(E1_obs,E2_obs)-E3_obs)/(E0-min(E1_obs,E2_obs)) |
| beta_obs_ci | The 95% confidence interval for beta_obs based on Monte Carlo sampling |
| log_alpha12 | Log of synergistic potency (drug1’s affect on potency of drug2). Values < 0 are antagonistically potent. Values >0 are synergistically potent. Alpha1 is quantifies the shift in the EC50 of drug 2 at saturating conc of d1. |
| log_alpha12_ci | Uncertainty in log_alpha1 |
| log_alpha21 | Log of synergistic potency (drug2’s affect on potency of drug1). Values < 0 are antagonistically potent. Values >0 are synergistically potent. Alpha2 is quantifies the shift in the EC50 of drug 1 at saturating conc of d2. |
| log_alpha21_ci | Uncertainty in log_alpha2 |
| R2 | R-squared of fit |
| log_like_mc_nlls | Log likelihood of the parameter set |
| E0 | Fitted basal effect when [d1]=[d2]=0 |
| E0_ci | The 95% confidence interval for E0 |
| E1 | Fitted effect for [d1]->inf and [d2]=0 |
| E1_ci | The 95% confidence interval E1 |
| E2 | Value of fit at max tested conc. d1 and [d2]=0 |
| E2_ci | The 95% confidence interval E1_obs |
| E3 | Fitted effect for [d2]->inf and [d1]=0 |
| E3_ci | The 95% confidence interval E2 |
| E1_obs | Value of fit at max tested conc. d2 and [d1]=0 |
| E1_obs_ci | The 95% confidence interval E2_obs |
| E2_obs | Fitted effect for [d1]->inf and [d1]->inf |
| E2_obs_ci | The 95% confidence interval E3 |
| E3_obs | Value of fit at max tested conc. d1 and d2 |
| E3_obs_ci | The 95% confidence interval E3_obs |
| log_C1 | Log of the EC50 for drug 1 |
| log_C1_ci | Uncertainty in log_C1 |
| log_C2 | Log of the EC50 for drug 2 |
| log_C2_ci | Uncertainty in log_C2 |
| log_h1 | Log of the hill slope d1 |
| log_h1_ci | 95% confidence interval of log_h1 |
| log_h2 | Log of hill slope d2 |
| log_h2_ci | 95% confidence interval of log_h2 |
| h1 | Hill slope d1 |
| h2 | Hill slope d2 |
| C1 | EC50 drug1 |
| C2 | EC50 drug2 |
| time_total | Time to fit |
| drug1_units | Drug 1 units |
| drug2_units | Drug 2 units |
| metric_name | Name of metric of drug effect |
| fit_beta | Was Emax fixed such that beta=0? 1=Yes; 0=No |
| boundary_sampling | Was boundary sampling fit used |
| max_conc_d1 | Maximum tested concentration of drug 1 |
| max_conc_d2 | Maximum tested concentration of drug 2 |
| min_conc_d1 | Minimum tested concentration of drug 1 |
| min_conc_d2 | Minimum tested concentration of drug 2 |
| fit_method | What method was used to fit the 2D Hill equation |
| dataset_name | Name of dataset in MuSyC portal |
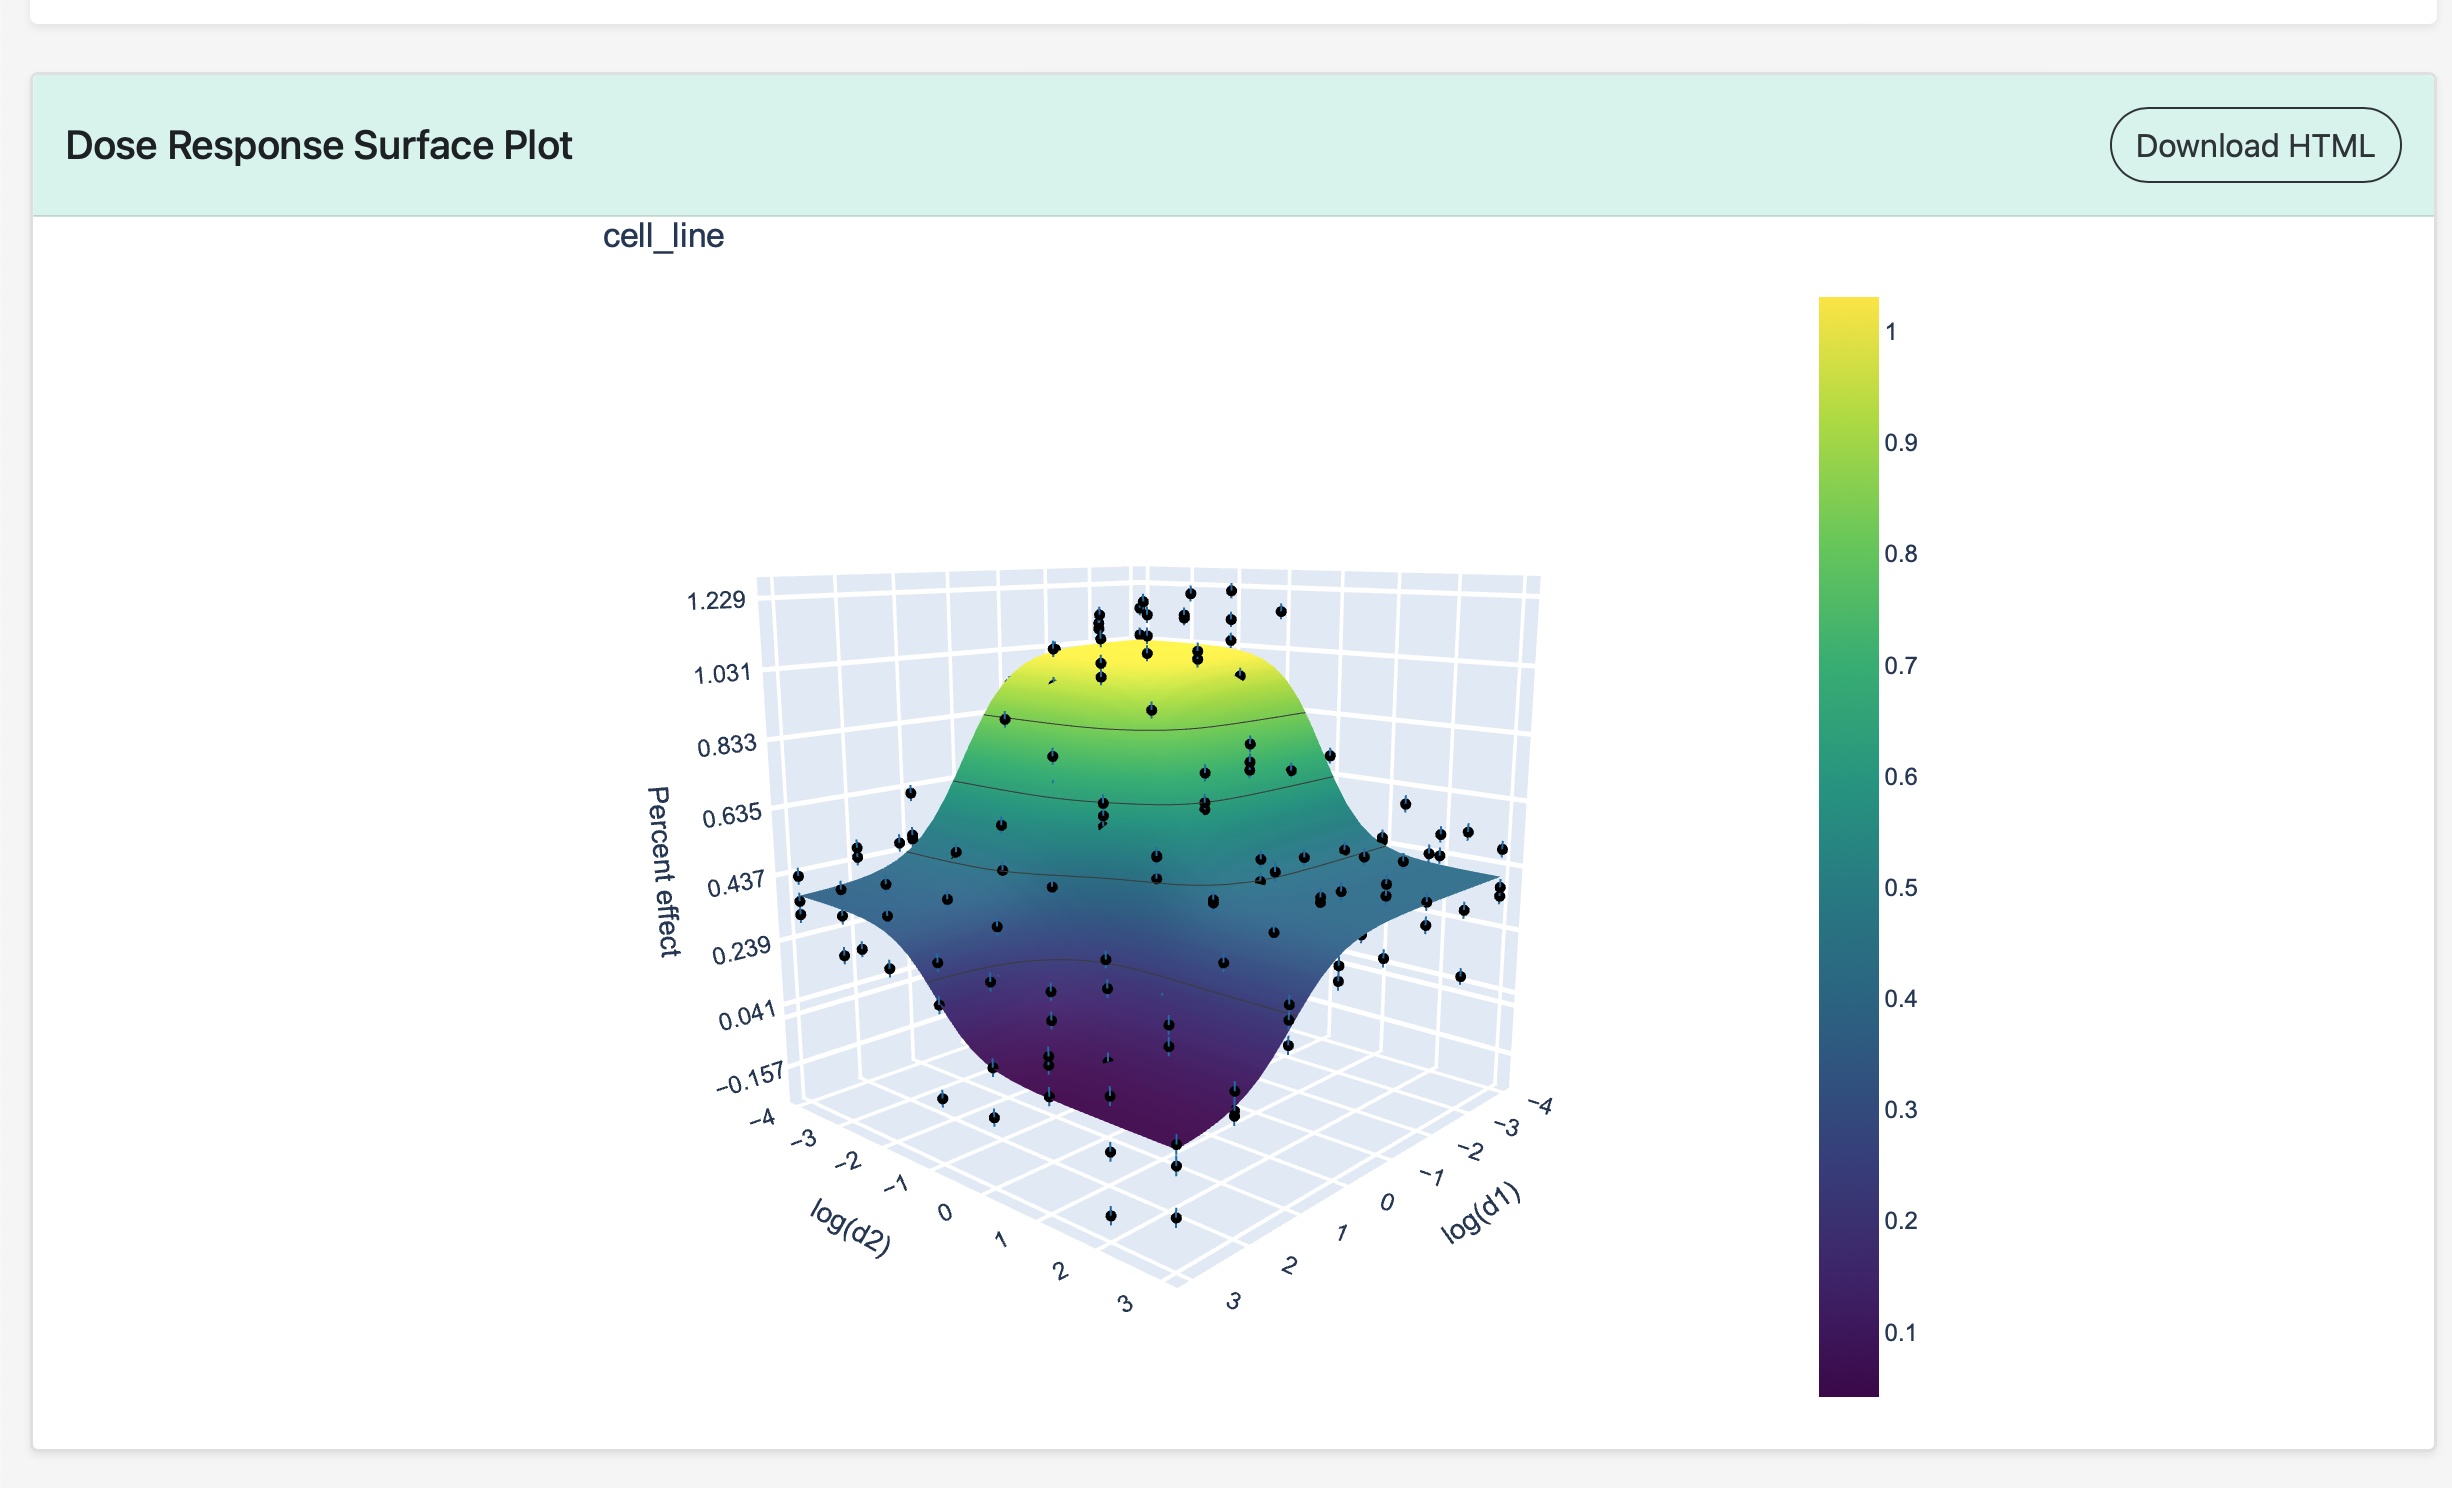
Dose-Response Surface Plot
Below the fitting parameter table is the dose-reponse surface generated by the MuSyC algorithm. All plots on the MuSyC site are generated using Plotly, so they are interactive with the ability to zoom, pan, tilt, and hover over data points to view detailed information. All plots can be downloaded as HTML files by clicking the Download HTML button.
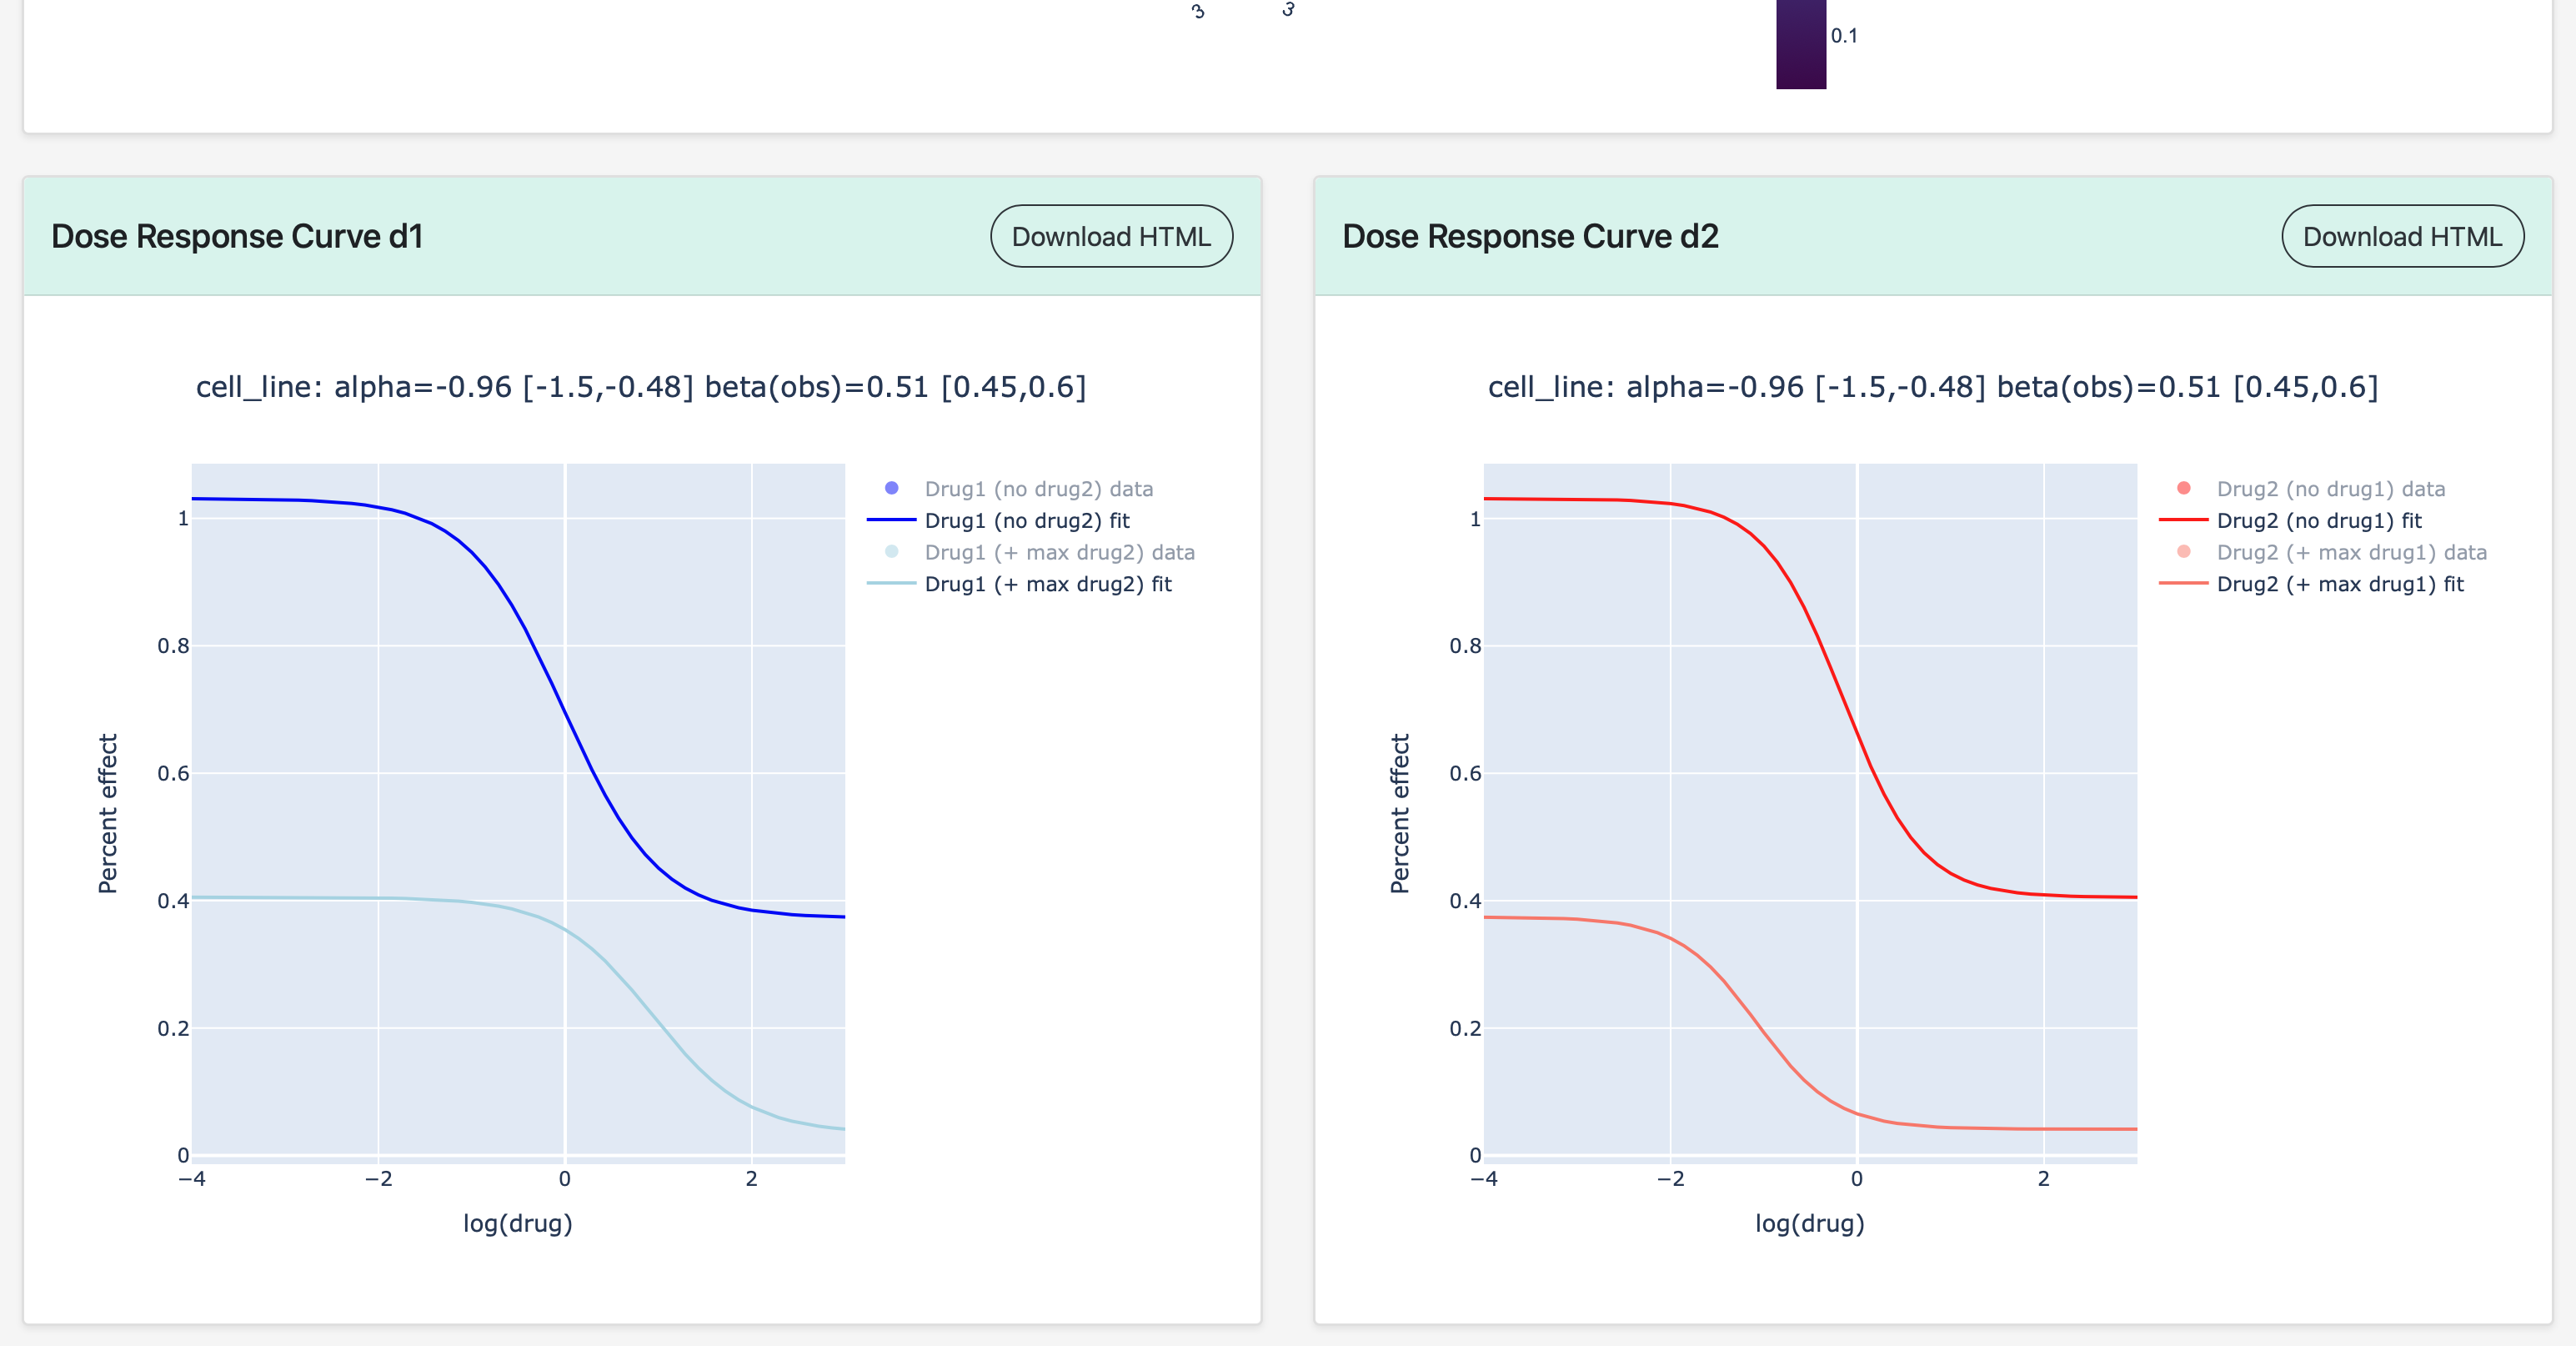
Dose-Response Curves
At the bottom of the Synergy Model Fit page are the dose-response curves for each drug in the combination.
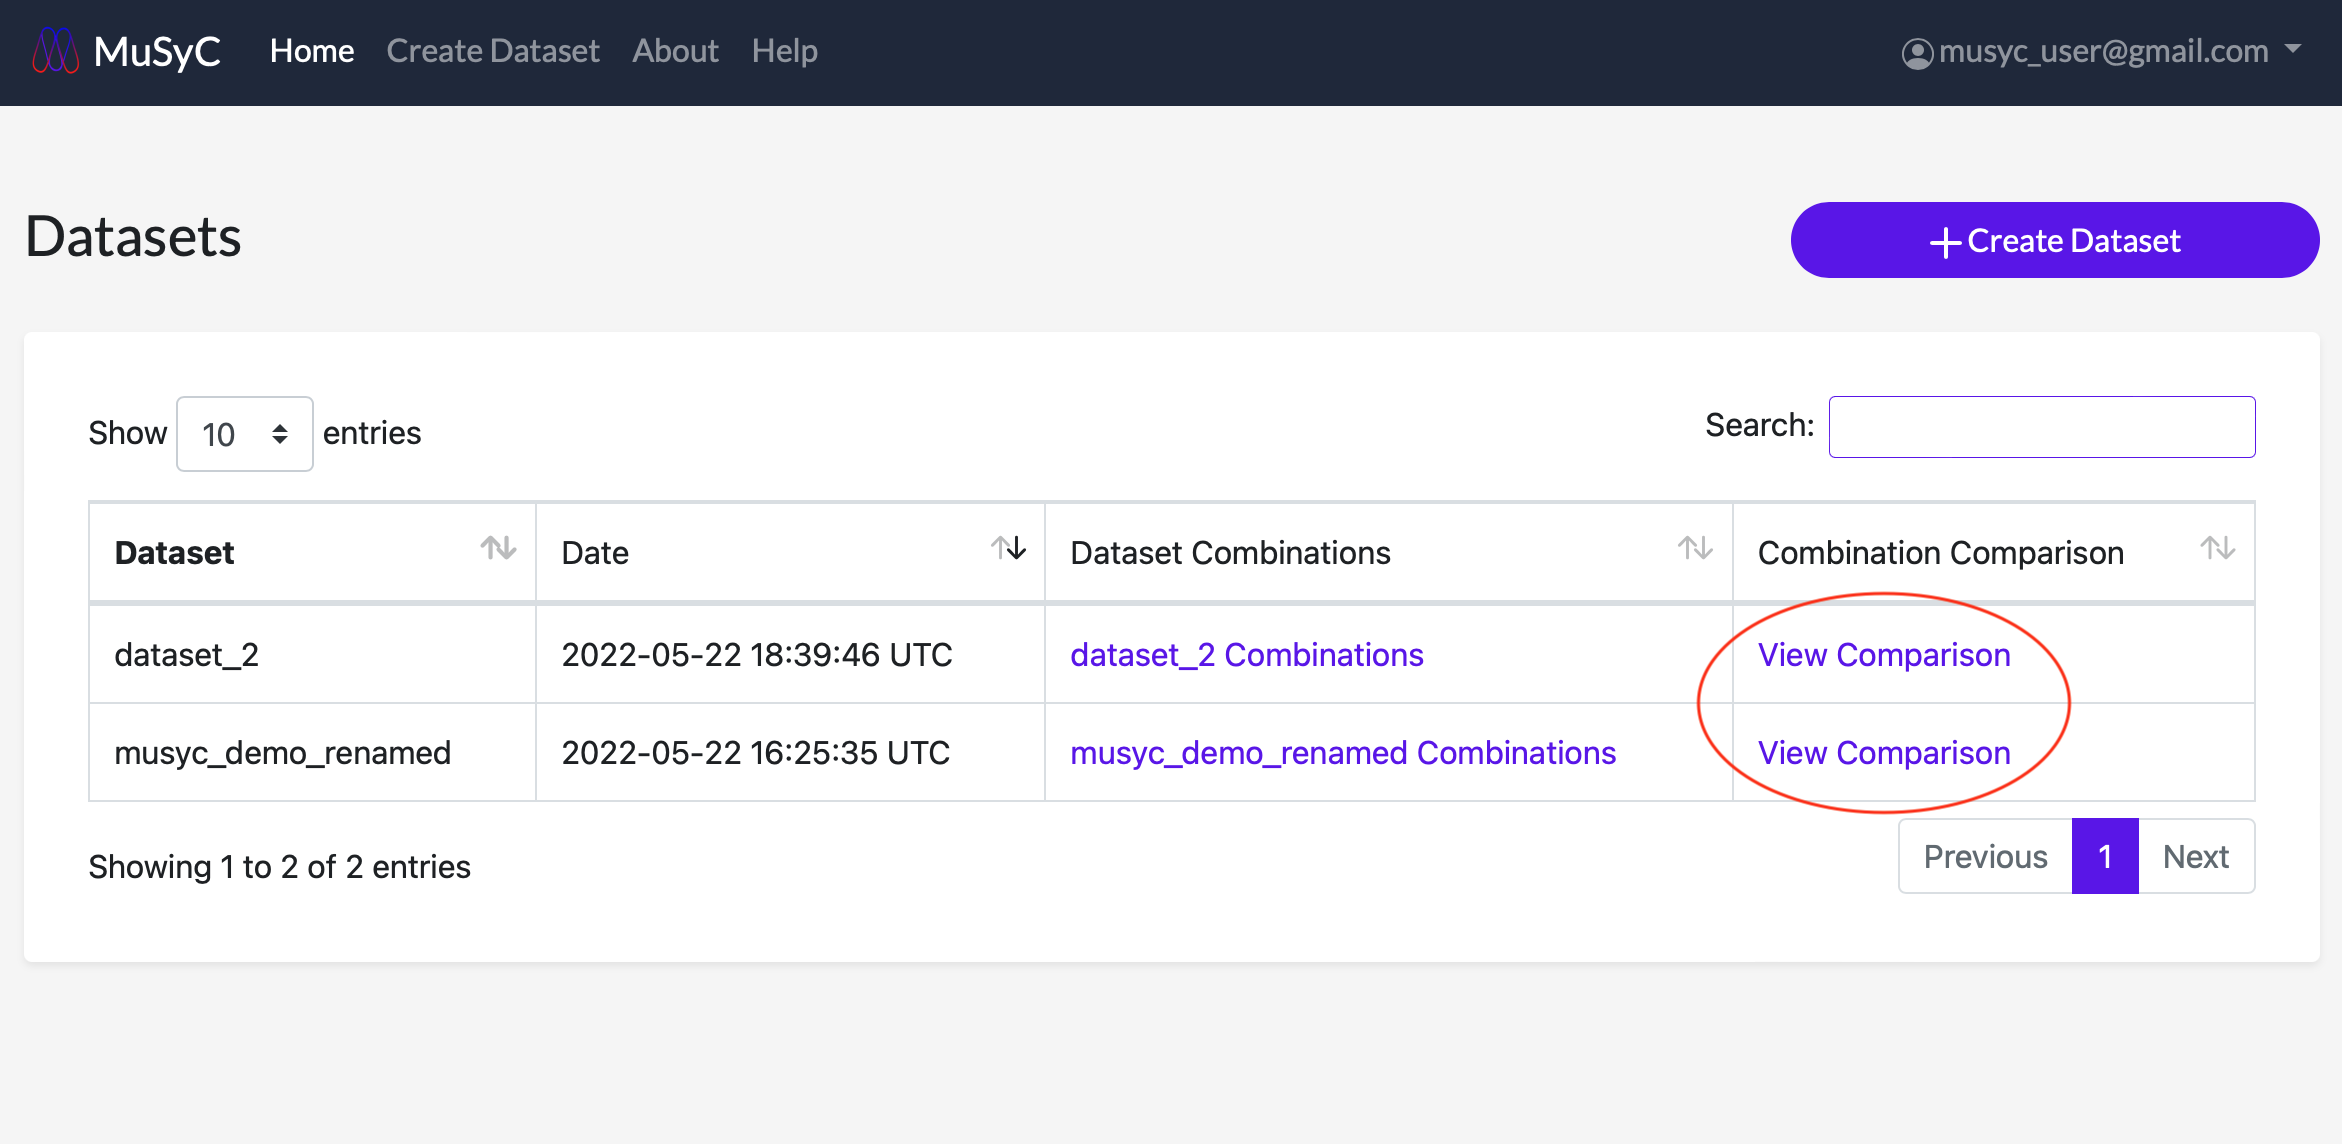
Synergy Parameter Plots
A comparison of the model fitting parameters for every drug and drug combination can be accessed by clicking View Comparison under the Combination Comparison column in the dataset table.
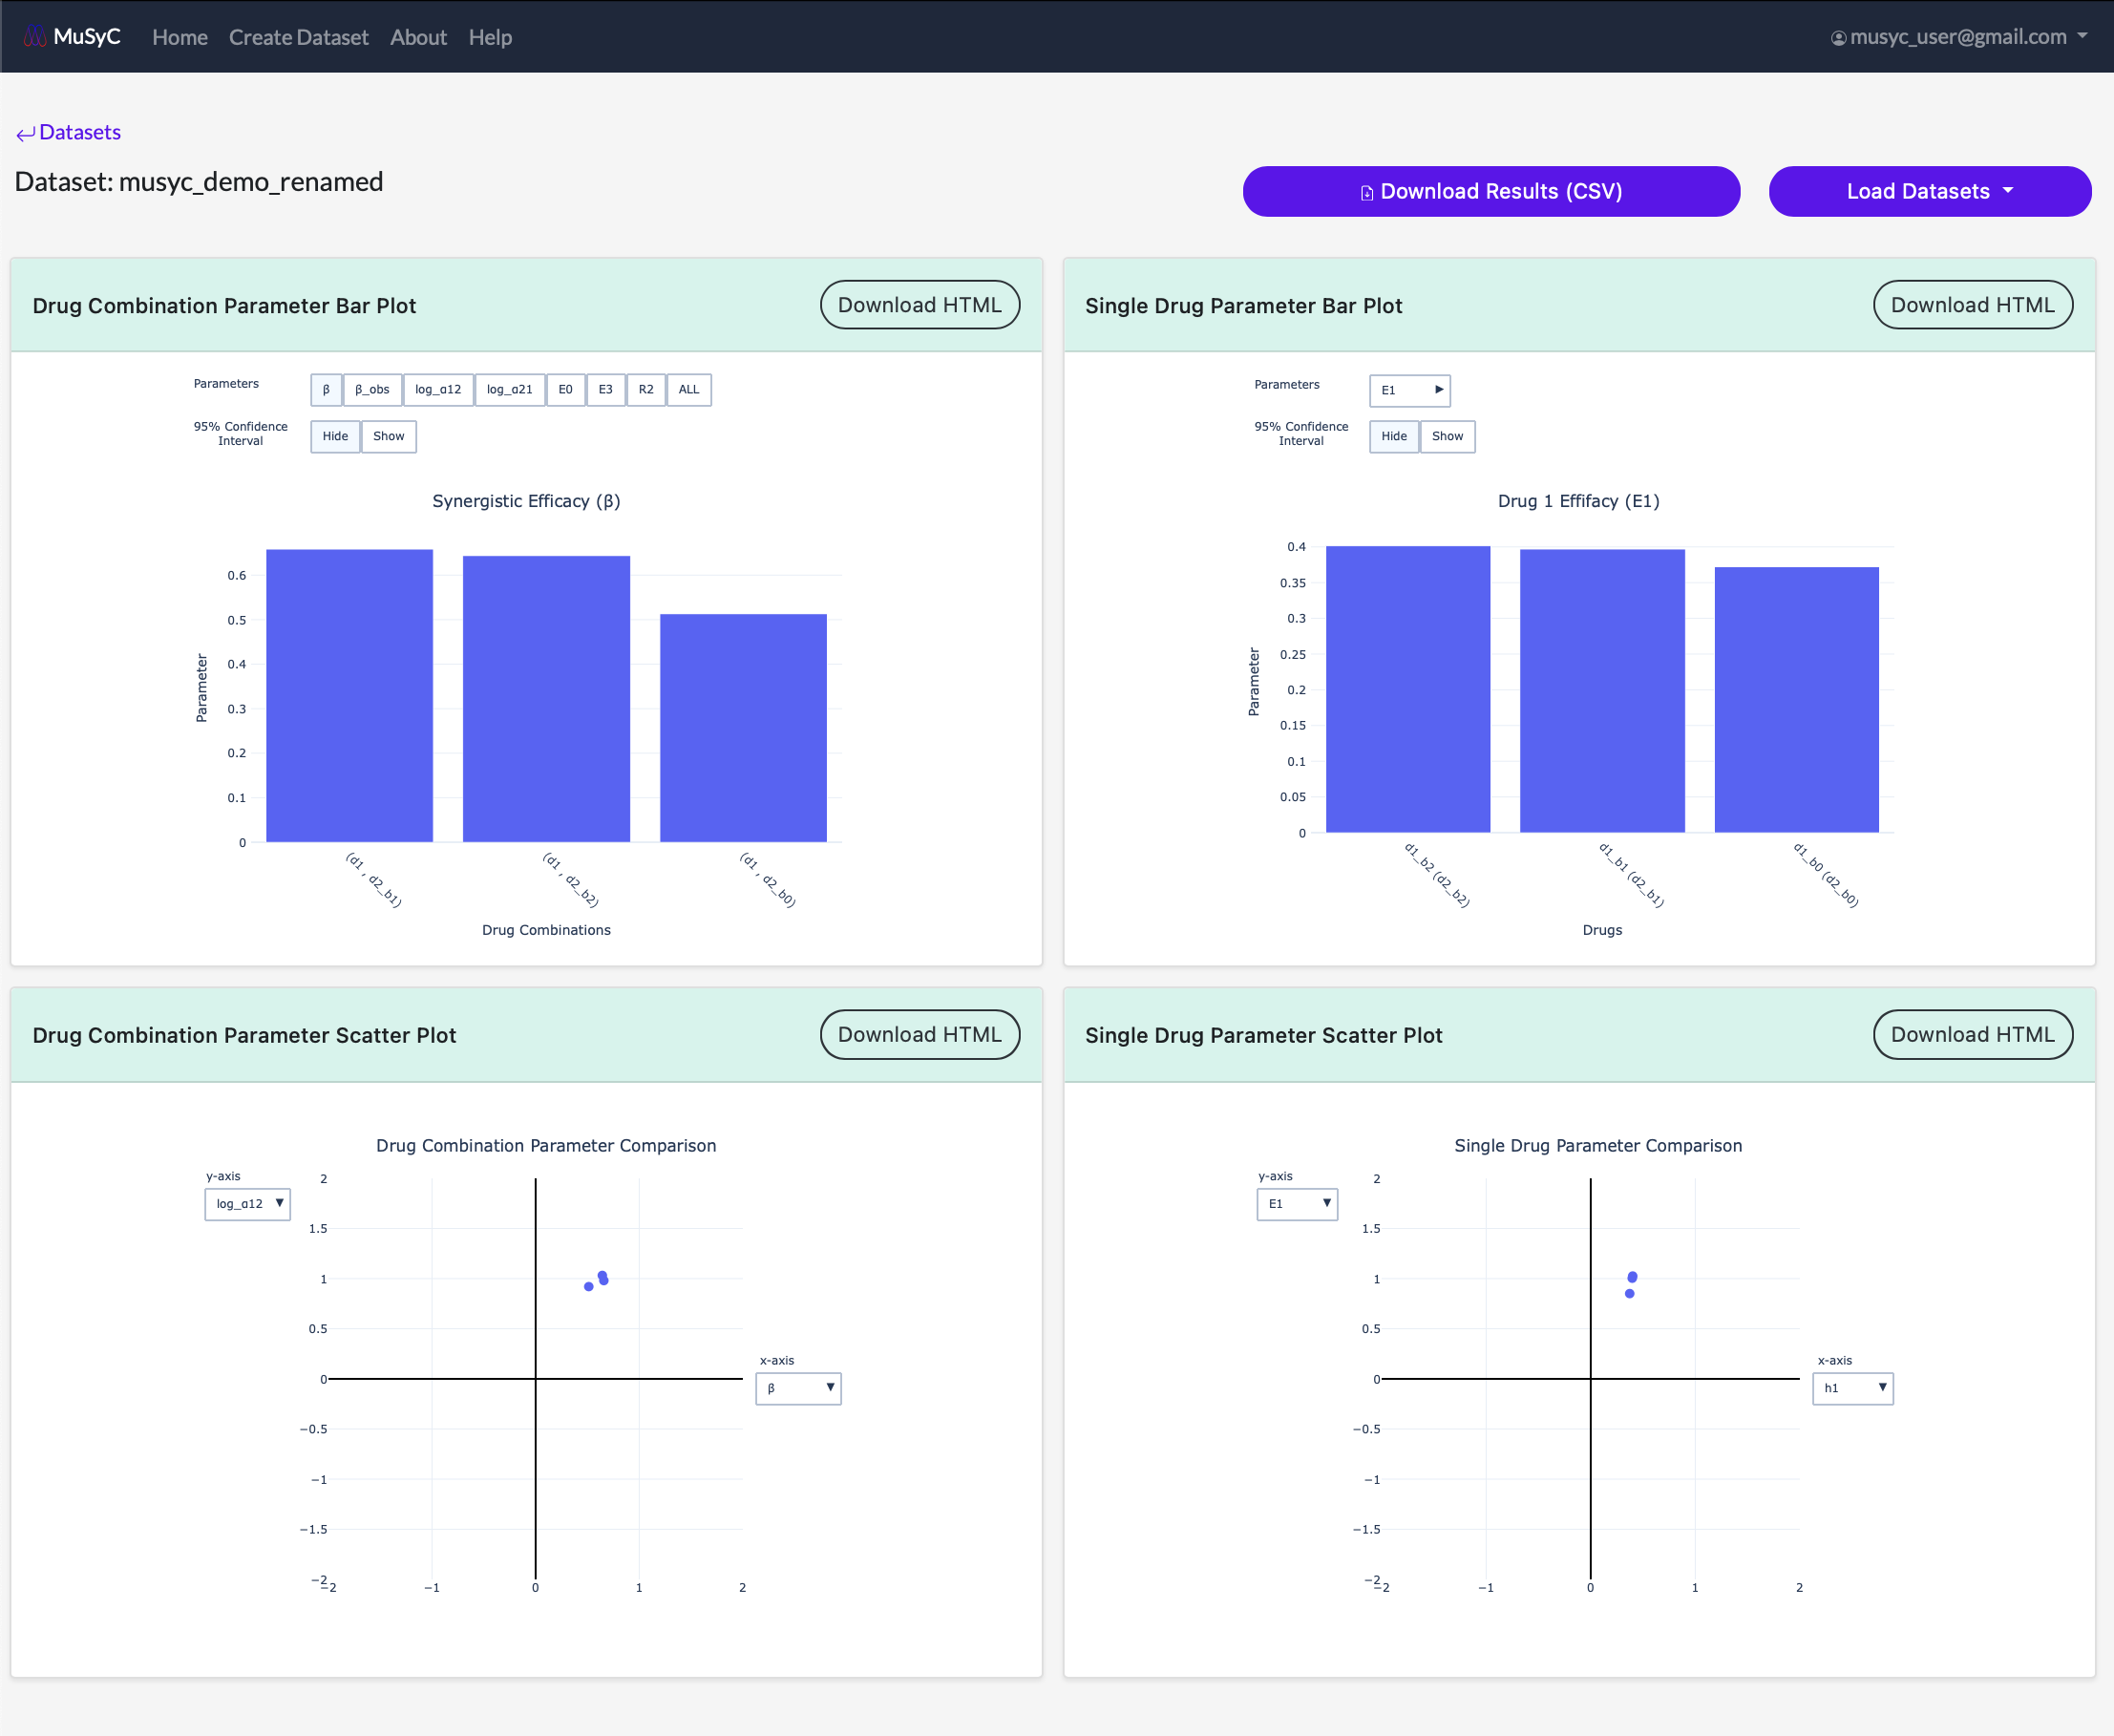
For each plot, you can hover over each data point to see more detailed parameter information. You can also click on individual data points to open the corresponding dose response surface plot in a new window.
Plot Types
- Drug Combination Bar Plot: Plots the drug combination parameters for each task in the dataset as a bar plot in descending order
- Single Drug Bar Plot: Plots the single drug parameters for each task in the dataset as a bar plot in descending order
- Drug Combination Scatter Plot: Plots two drug combination paramters. The parameter on each axis can be selected using the dropdown menu on the plot. The newly selected values will load automatically.
- Single Drug Scatter Plot: Plots two single drug paramters. The parameter on each axis can be selected using the dropdown menu on the plot. The newly selected values will load automatically.
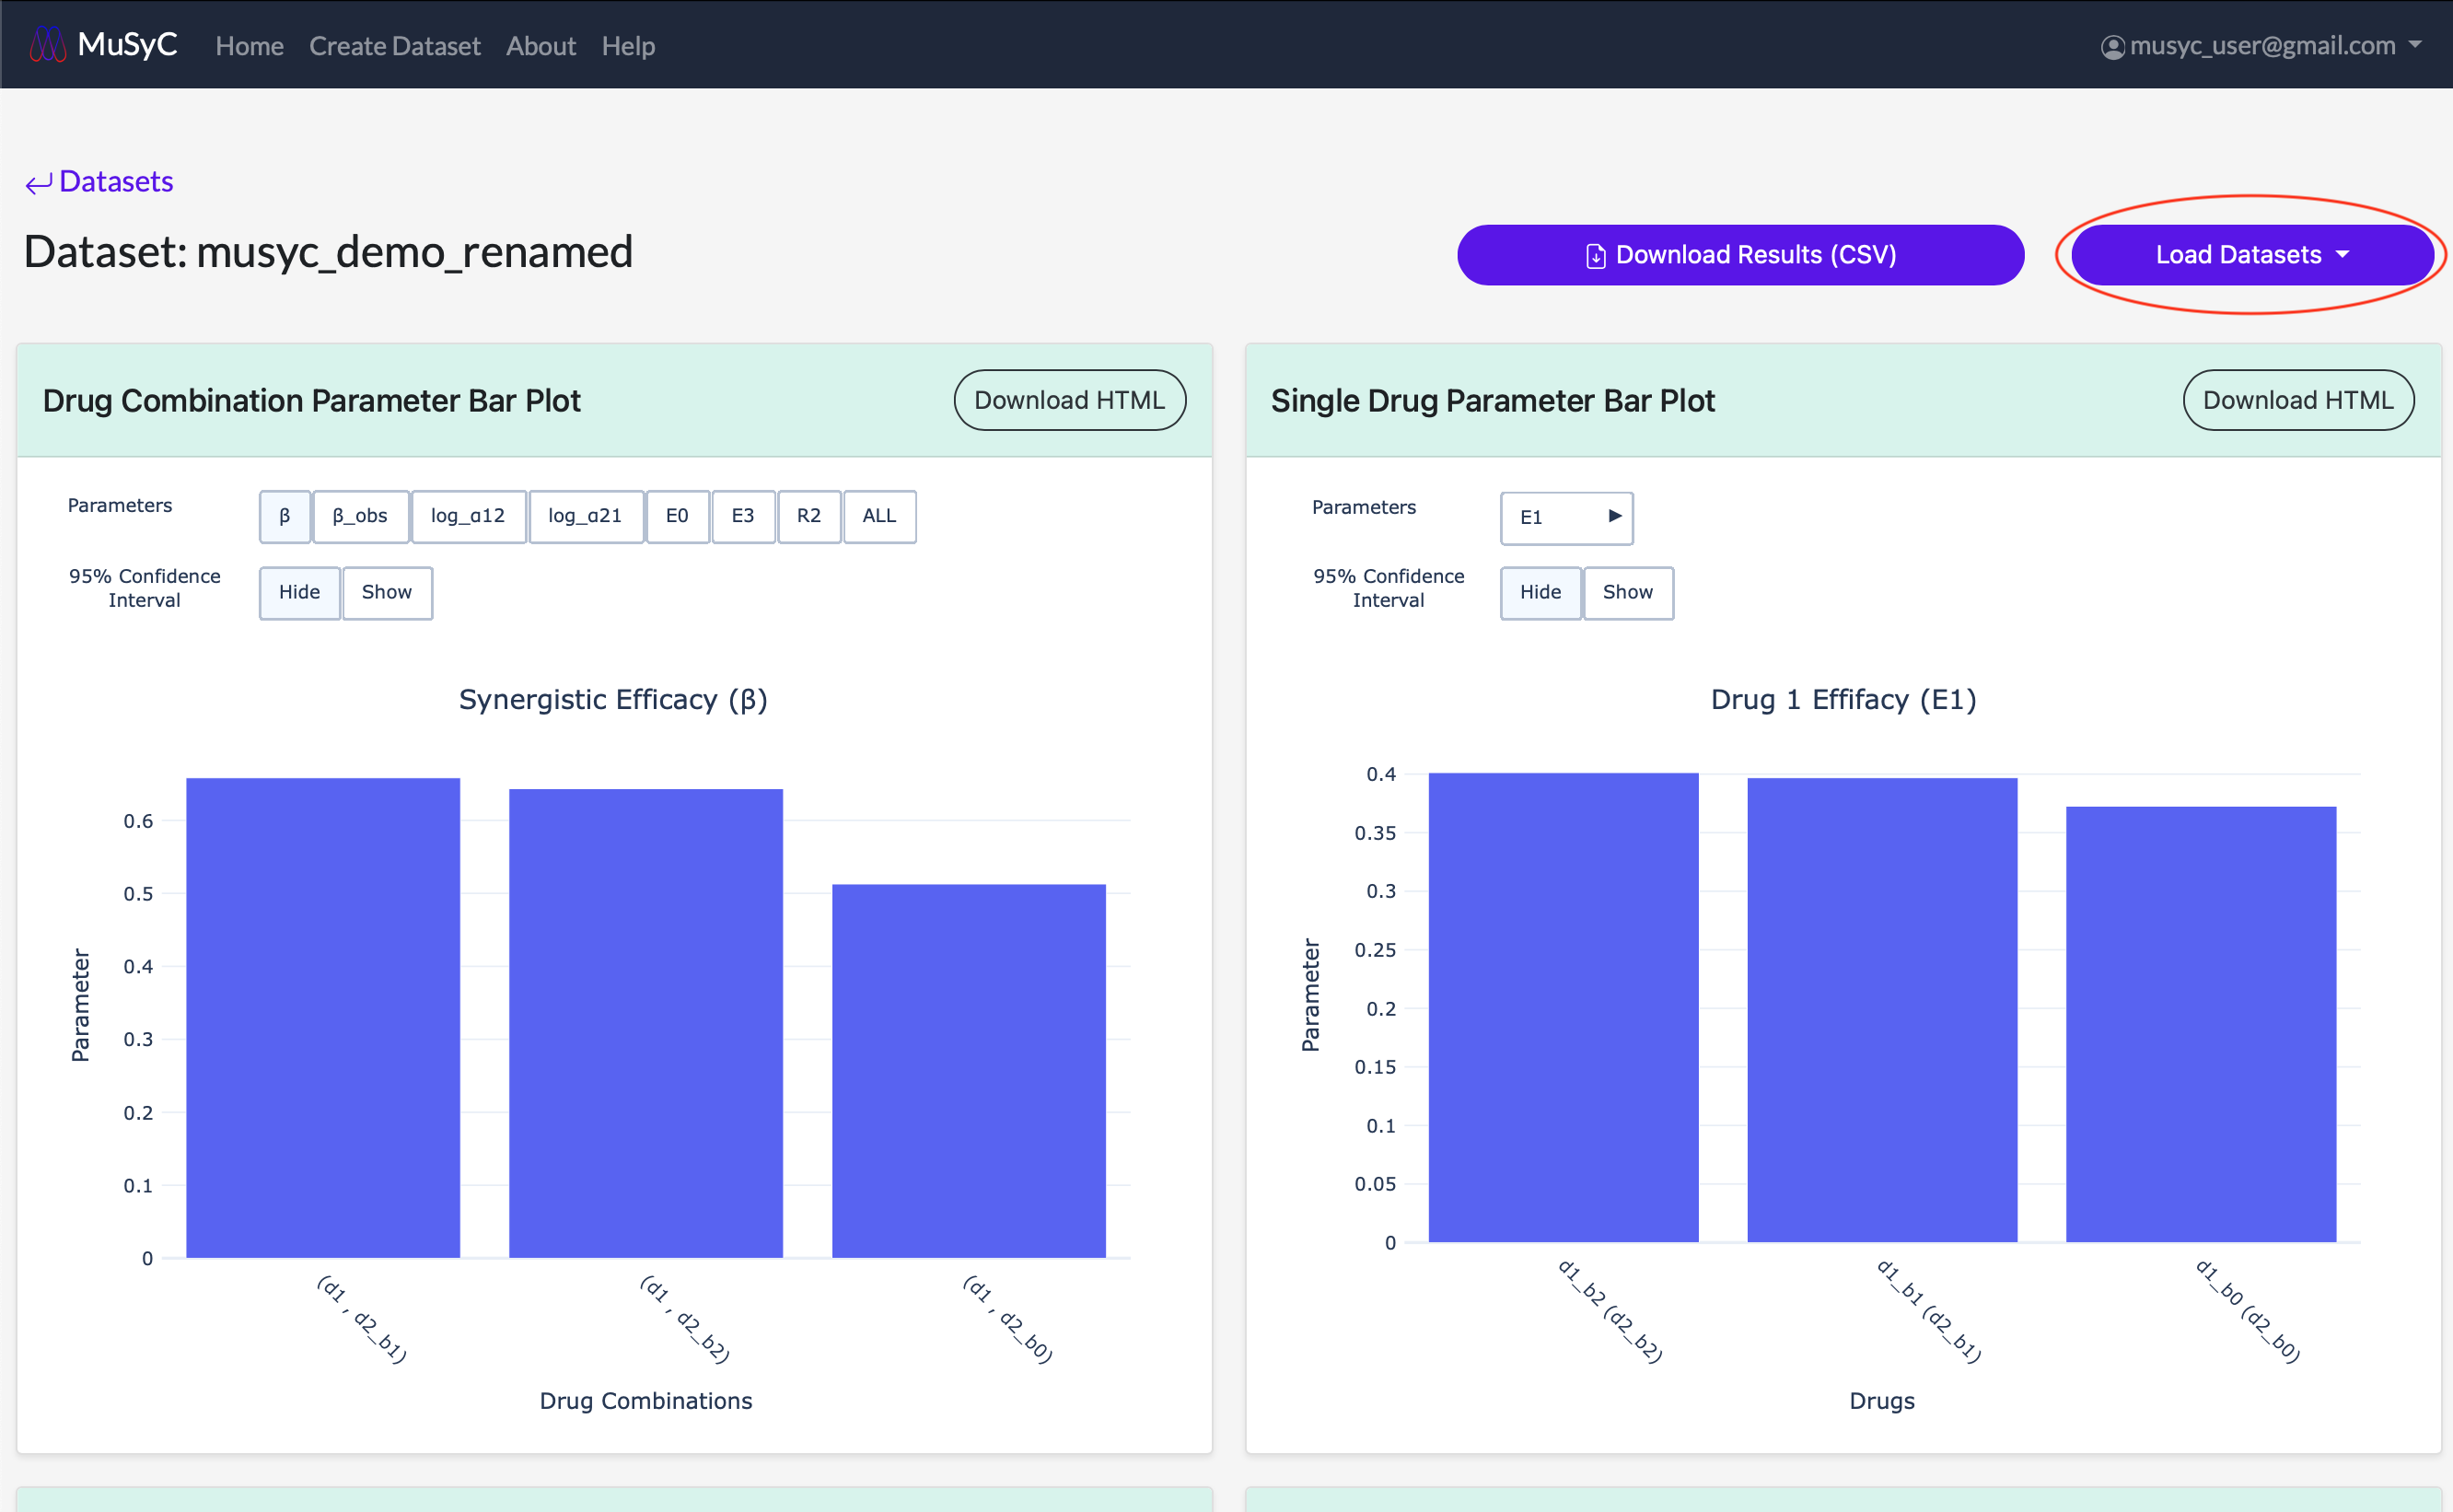
Compare Datasets
- 1
- Click on the Load Datasets dropdown button to open a list of all datasets you own.
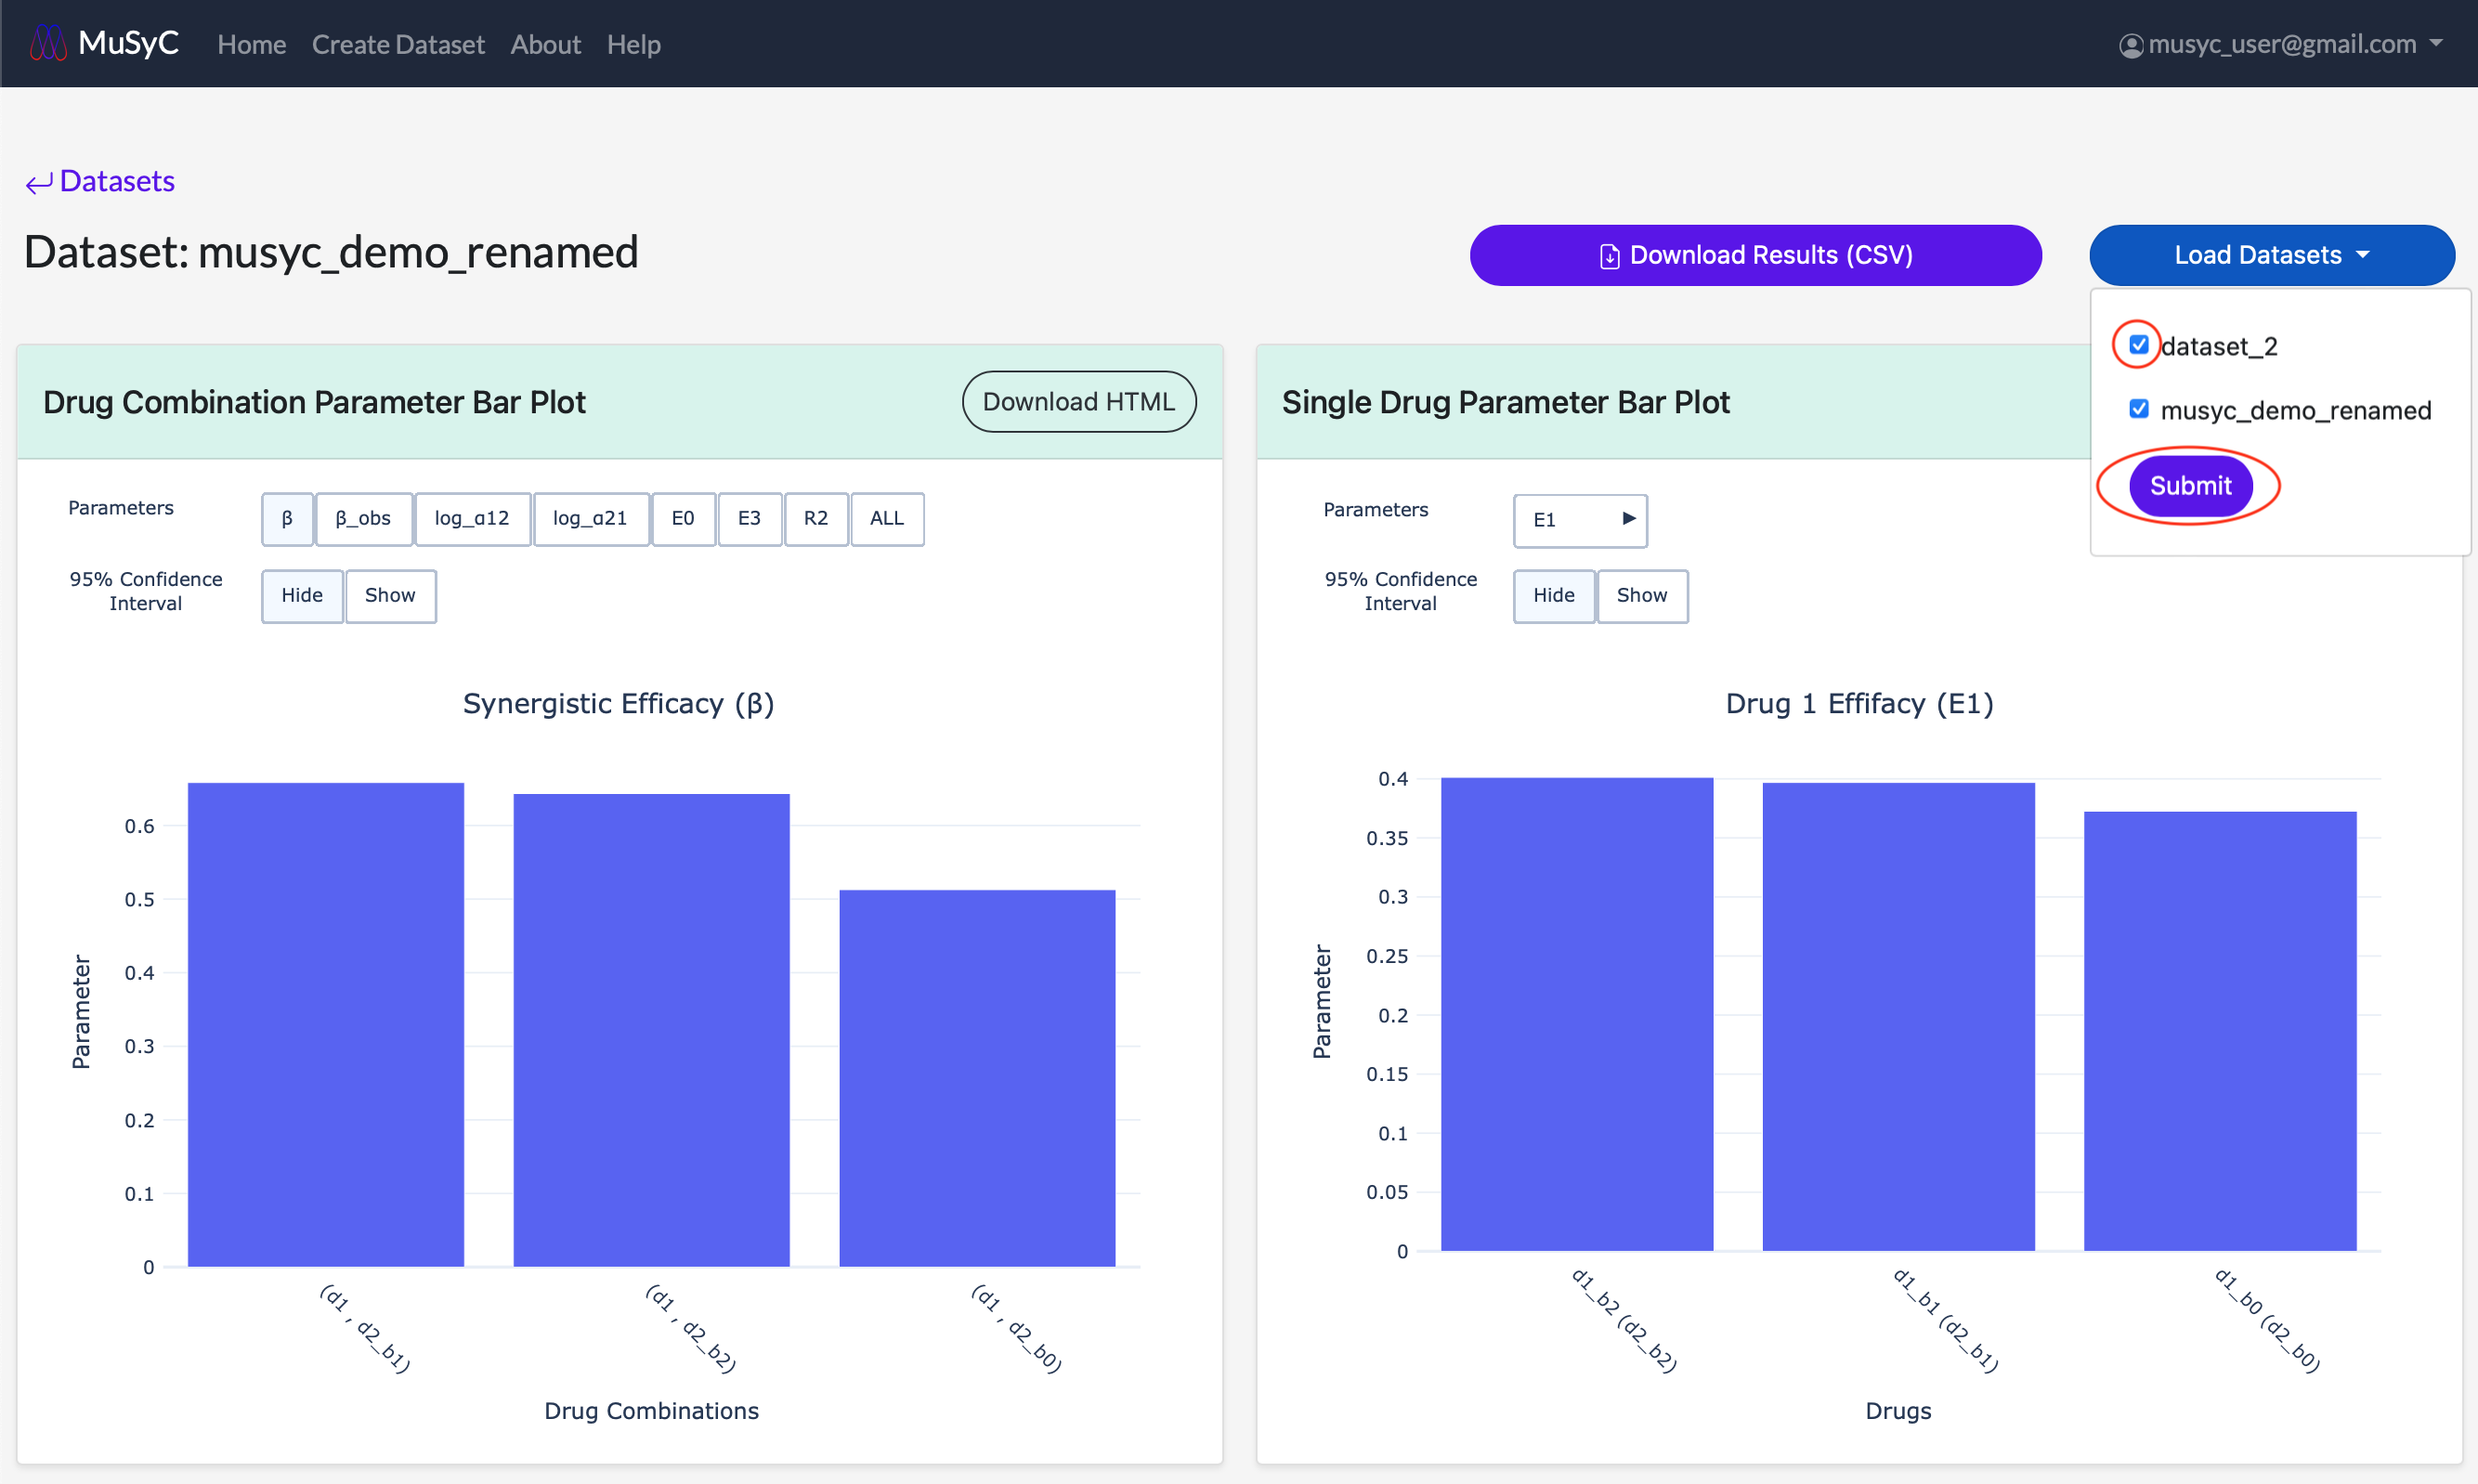
- 2
- Use the checkboxes to select the datasets you want to load into the parameter plots. Make sure to click Submit after your selections are made.
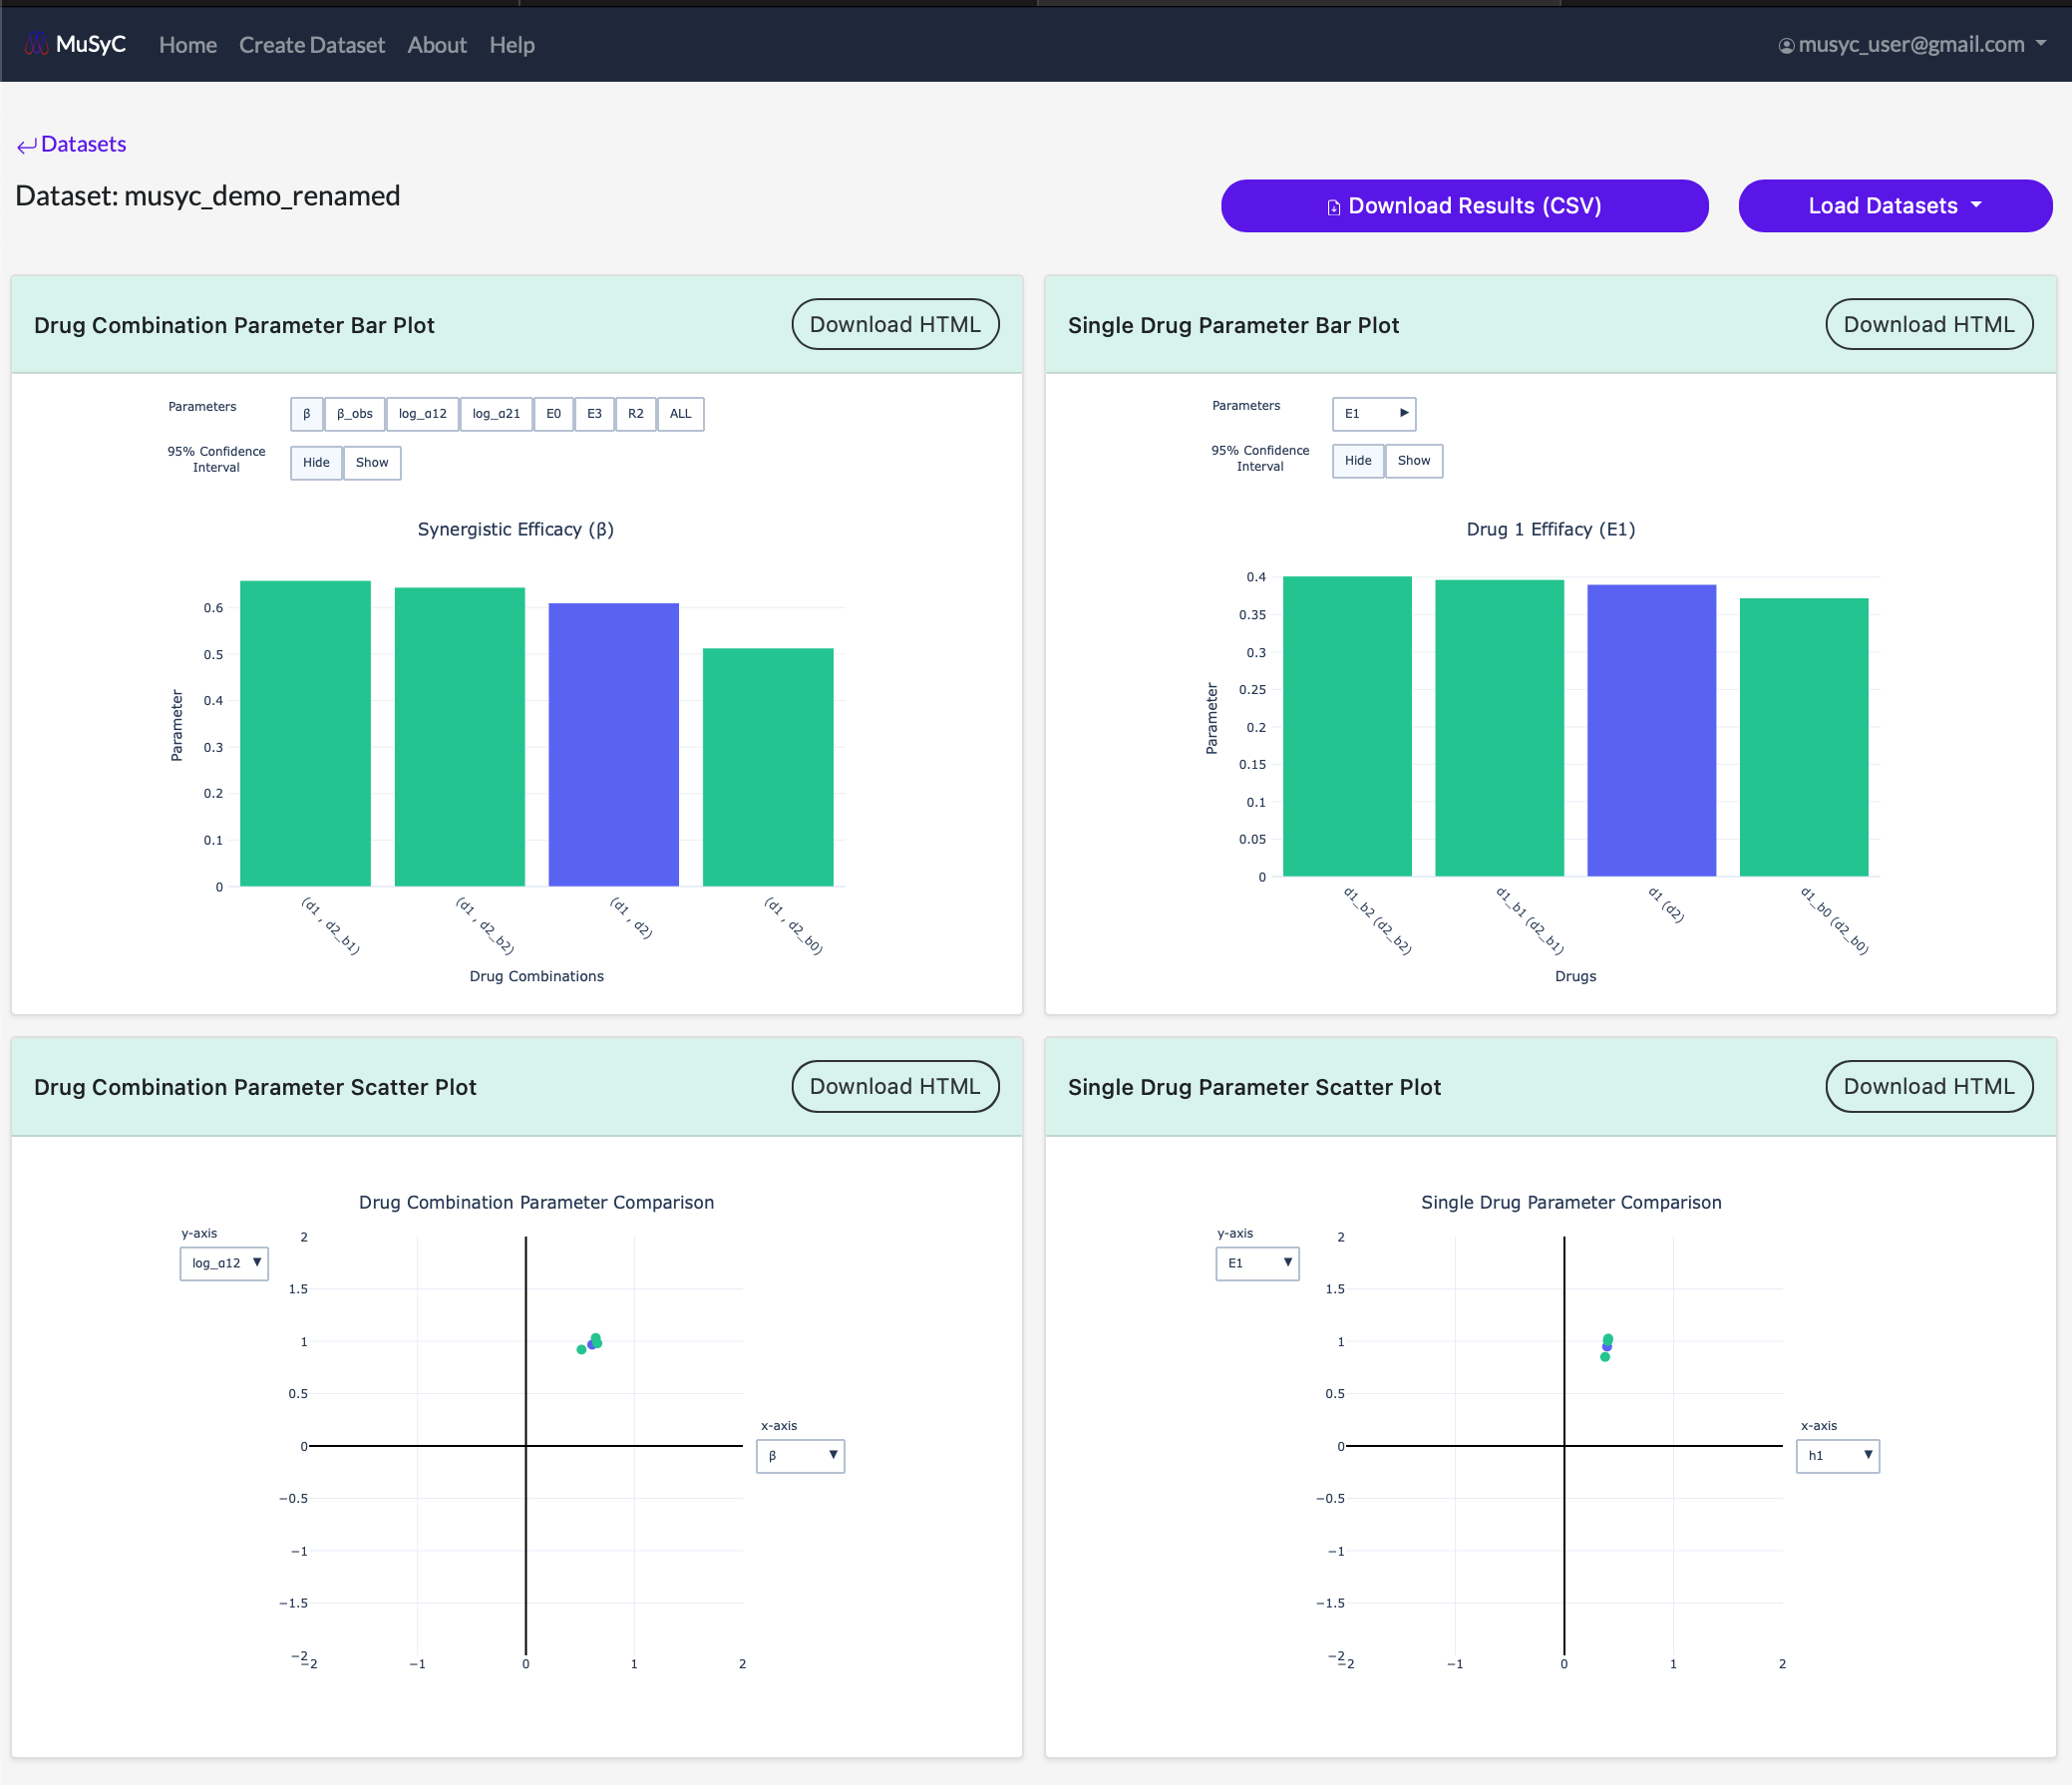
- 3
- The updated plots will begin to load one by one. Each plotted dataset can be diffrentiated by color (the hover text also contains the dataset name).
Contact
Please send questions, issues, and/or commercial licensing requests to: musyc@gmail.com.